USD/CHF Price Analysis: Retreats towards 100-SMA near 0.9980


  • USD/CHF takes offers to extend the previous day’s pullback from a one-week-old resistance line.
  • Impending bear cross on MACD, sluggish RSI suggests further downside.
  • 200-SMA appears a tough nut to crack for bears, upside moves need validation from 1.0035.

USD/CHF drops for the second consecutive day after reversing from an eight-day-old resistance line, refreshing intraday low near 0.9990 during Wednesday’s Asian session.

The Swiss currency (CHF) pair’s latest pullback, however, appears to have a limited downside room as it approaches the 100-SMA support near 0.9980.

Even so, the looming bearish cross on the MACD and the recent retreat of the RSI (14) seem to favor the USD/CHF sellers.

That said, an upwards-sloping support line from October 27, close to 0.9930 by the press time, could lure the bears to breaking the 0.9980 support.

It’s worth noting that the pair’s weakness past 0.9930 will make it vulnerable to challenge October’s low of 0.9780. However, the 200-SMA and the previous weekly bottom, respectively near 0.9900 and 0.9840, could test the USD/CHF bears.

Alternatively, the pair’s recovery beyond the 1.0005 immediate resistance needs validation from a one-week-old horizontal hurdle surrounding 1.0035.

Following that, a run-up toward the previous monthly peak of 1.0147 appears imminent. It should be observed that there are multiple levels near 1.0070 to challenge the USD/CHF bulls.

USD/CHF: Four-hour chart

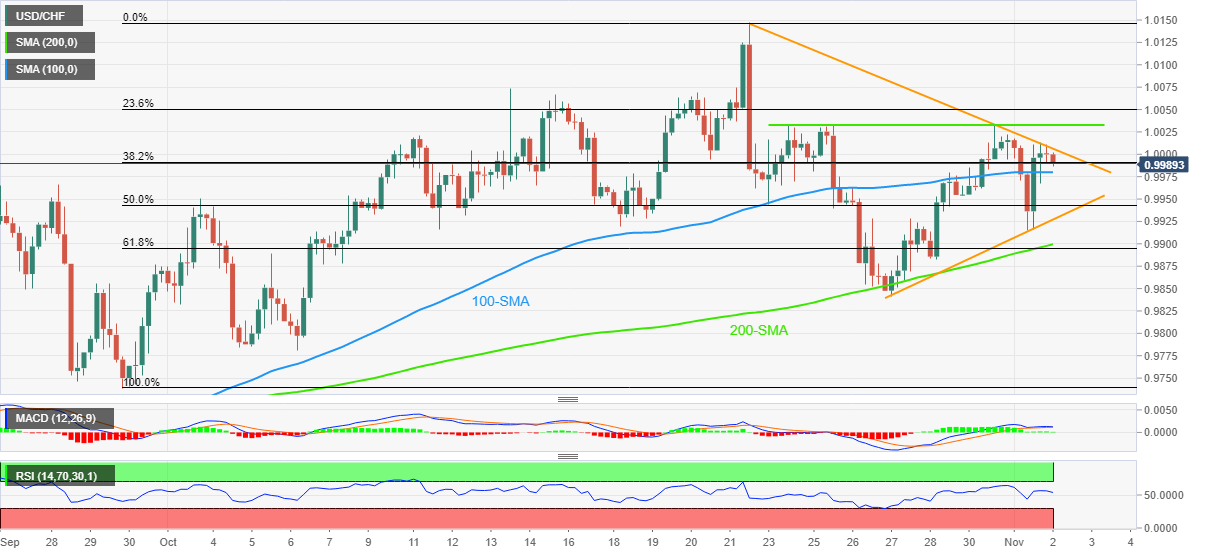
Trend: Further downside expected

Additional important levels

Overview
Today last price 0.9985
Today Daily Change -0.0013
Today Daily Change % -0.13%
Today daily open 0.9998
 
Trends
Daily SMA20 0.9968
Daily SMA50 0.9828
Daily SMA100 0.9727
Daily SMA200 0.96
 
Levels
Previous Daily High 1.0022
Previous Daily Low 0.9915
Previous Weekly High 1.0032
Previous Weekly Low 0.9842
Previous Monthly High 1.0148
Previous Monthly Low 0.9781
Daily Fibonacci 38.2% 0.9956
Daily Fibonacci 61.8% 0.9981
Daily Pivot Point S1 0.9935
Daily Pivot Point S2 0.9872
Daily Pivot Point S3 0.9828
Daily Pivot Point R1 1.0041
Daily Pivot Point R2 1.0085
Daily Pivot Point R3 1.0148


Share: Feed news

Information on these pages contains forward-looking statements that involve risks and uncertainties. Markets and instruments profiled on this page are for informational purposes only and should not in any way come across as a recommendation to buy or sell in these assets. You should do your own thorough research before making any investment decisions. FXStreet does not in any way guarantee that this information is free from mistakes, errors, or material misstatements. It also does not guarantee that this information is of a timely nature. Investing in Open Markets involves a great deal of risk, including the loss of all or a portion of your investment, as well as emotional distress. All risks, losses and costs associated with investing, including total loss of principal, are your responsibility. The views and opinions expressed in this article are those of the authors and do not necessarily reflect the official policy or position of FXStreet nor its advertisers. The author will not be held responsible for information that is found at the end of links posted on this page.

If not otherwise explicitly mentioned in the body of the article, at the time of writing, the author has no position in any stock mentioned in this article and no business relationship with any company mentioned. The author has not received compensation for writing this article, other than from FXStreet.

FXStreet and the author do not provide personalized recommendations. The author makes no representations as to the accuracy, completeness, or suitability of this information. FXStreet and the author will not be liable for any errors, omissions or any losses, injuries or damages arising from this information and its display or use. Errors and omissions excepted.

The author and FXStreet are not registered investment advisors and nothing in this article is intended to be investment advice.

Recommended content


Recommended content

Editors’ Picks

EUR/USD clings to gains above 1.0750 after US data

EUR/USD clings to gains above 1.0750 after US data

EUR/USD manages to hold in positive territory above 1.0750 despite retreating from the fresh multi-week high it set above 1.0800 earlier in the day. The US Dollar struggles to find demand following the weaker-than-expected NFP data.

EUR/USD News

GBP/USD declines below 1.2550 following NFP-inspired upsurge

GBP/USD declines below 1.2550 following NFP-inspired upsurge

GBP/USD struggles to preserve its bullish momentum and trades below 1.2550 in the American session. Earlier in the day, the disappointing April jobs report from the US triggered a USD selloff and allowed the pair to reach multi-week highs above 1.2600.

GBP/USD News

Gold struggles to hold above $2,300 despite falling US yields

Gold struggles to hold above $2,300 despite falling US yields

Gold stays on the back foot below $2,300 in the American session on Friday. The benchmark 10-year US Treasury bond yield stays in negative territory below 4.6% after weak US data but the improving risk mood doesn't allow XAU/USD to gain traction.

Gold News

Bitcoin Weekly Forecast: Should you buy BTC here? Premium

Bitcoin Weekly Forecast: Should you buy BTC here?

Bitcoin (BTC) price shows signs of a potential reversal but lacks confirmation, which has divided the investor community into two – those who are buying the dips and those who are expecting a further correction.

Read more

Week ahead – BoE and RBA decisions headline a calm week

Week ahead – BoE and RBA decisions headline a calm week

Bank of England meets on Thursday, unlikely to signal rate cuts. Reserve Bank of Australia could maintain a higher-for-longer stance. Elsewhere, Bank of Japan releases summary of opinions.

Read more

Forex MAJORS

Cryptocurrencies

Signatures