USD/CHF Price Analysis: Extends pullback from 200-SMA towards 0.8700 on US NFP day


  • USD/CHF takes offers to refresh intraday low after reversing from three-week high the previous day.
  • Bearish MACD signals, RSI’s retreat from nearly overbought territory lure Swiss Franc pair sellers.
  • Multiple hurdles challenge downside momentum before highlighting yearly low marked the last week.

USD/CHF drops for the second consecutive day while printing mild losses near 0.8735 amid early Friday. In doing so, the Swiss Franc (CHF) pair extends the previous day’s U-turn from the highest level in three weeks ahead of the US Nonfarm Payrolls (NFP) data for July.

Also read: USD/CHF consolidates its recent gains above the 0.8740 area, eyes on US NFP

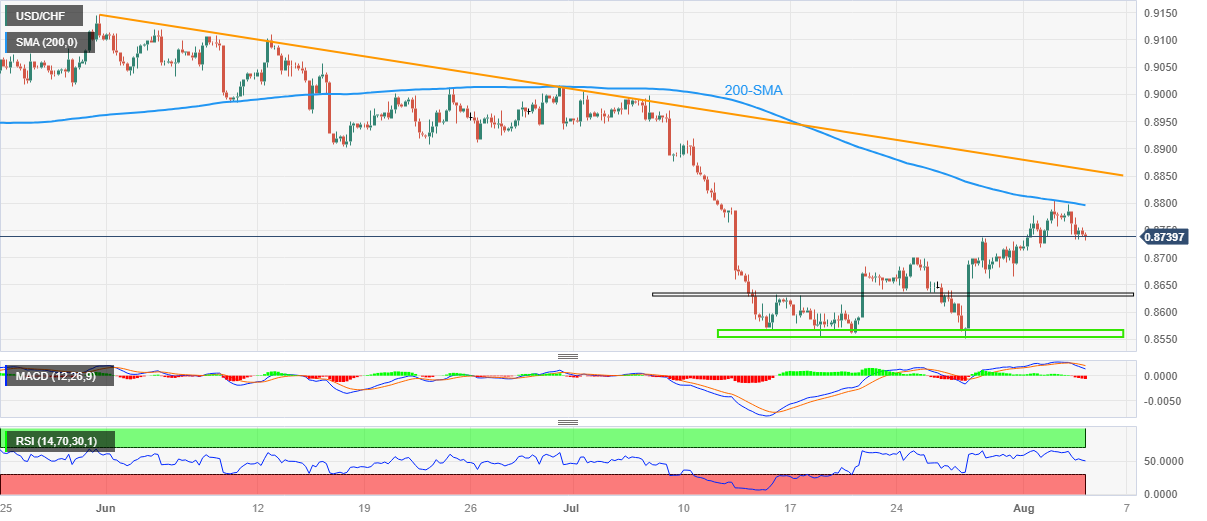
That said, the USD/CHF pair’s latest weakness could also be linked to the failure to cross the 200-SMA, as well as bearish MACD signals and the RSI (14) line’s decline from nearly overbought territory.

With this, the Loonie pair is likely to decline further, which in turn highlights the July 25 swing high of around the 0.8700 round figure.

However, multiple levels marked during late July highlight key support areas around 0.8630 and 0.8565–55.

In a case where the USD/CHF drops below 0.8555, the odds of witnessing the pair’s quick fall toward the 0.8500 round figure can’t be ruled out.

Alternatively, a clear upside break of the 200-SMA surrounding 0.8800 can recall short-term USD/CHF buyers but a downward-sloping resistance line from May 31, close to 0.8865 at the latest, will be a tough nut to crack for them before retaking control.

Even so, the mid-June swing low of around 0.8905 can act as an extra filter towards the north.

USD/CHF: Four-hour chart

Trend: Pullback expected

Additional important levels

Overview
Today last price 0.874
Today Daily Change -0.0003
Today Daily Change % -0.03%
Today daily open 0.8743
 
Trends
Daily SMA20 0.8692
Daily SMA50 0.888
Daily SMA100 0.8949
Daily SMA200 0.9161
 
Levels
Previous Daily High 0.8799
Previous Daily Low 0.8733
Previous Weekly High 0.8737
Previous Weekly Low 0.8552
Previous Monthly High 0.9005
Previous Monthly Low 0.8552
Daily Fibonacci 38.2% 0.8758
Daily Fibonacci 61.8% 0.8774
Daily Pivot Point S1 0.8718
Daily Pivot Point S2 0.8693
Daily Pivot Point S3 0.8652
Daily Pivot Point R1 0.8783
Daily Pivot Point R2 0.8824
Daily Pivot Point R3 0.8849


Share: Feed news

Information on these pages contains forward-looking statements that involve risks and uncertainties. Markets and instruments profiled on this page are for informational purposes only and should not in any way come across as a recommendation to buy or sell in these assets. You should do your own thorough research before making any investment decisions. FXStreet does not in any way guarantee that this information is free from mistakes, errors, or material misstatements. It also does not guarantee that this information is of a timely nature. Investing in Open Markets involves a great deal of risk, including the loss of all or a portion of your investment, as well as emotional distress. All risks, losses and costs associated with investing, including total loss of principal, are your responsibility. The views and opinions expressed in this article are those of the authors and do not necessarily reflect the official policy or position of FXStreet nor its advertisers. The author will not be held responsible for information that is found at the end of links posted on this page.

If not otherwise explicitly mentioned in the body of the article, at the time of writing, the author has no position in any stock mentioned in this article and no business relationship with any company mentioned. The author has not received compensation for writing this article, other than from FXStreet.

FXStreet and the author do not provide personalized recommendations. The author makes no representations as to the accuracy, completeness, or suitability of this information. FXStreet and the author will not be liable for any errors, omissions or any losses, injuries or damages arising from this information and its display or use. Errors and omissions excepted.

The author and FXStreet are not registered investment advisors and nothing in this article is intended to be investment advice.

Recommended content


Recommended content

Editors’ Picks

AUD/USD on the backfoot, slides below 0.6700

AUD/USD on the backfoot, slides below 0.6700

The Australian Dollar registered losses of 0.37% against the US Dollar on Monday, amid rising US Treasury yields that underpinned the Greenback. An upbeat market sentiment could not boost the high-beta Aussie Dollar, which tumbled below the 0.6700 figure. As the Asian session begins, the AUD/USD trades around 0.6668.

AUD/USD News

EUR/USD eased from 1.0880 on Monday as looming rate differential weighs

EUR/USD eased from 1.0880 on Monday as looming rate differential weighs

EUR/USD eased back from 1.0880 on Monday as talking points from Fed officials weighed on otherwise quiet market flows. Broader markets are keenly anxious for signs of a rate cut from the Fed, but central planners continue to force down expectations with a tricky inflation outlook hobbling the Fed’s options on rate moves.

EUR/USD News

Gold price retreats after hitting record high at $2,450

Gold price retreats after hitting record high at $2,450

Gold price extended its gains on Monday, yet it trades slightly below the all-time high of $2,450 reached during the Asian session amid increasing expectations that major central banks, including the Federal Reserve, might ease policy during 2024. 

Gold News

Digital asset weekly inflows jump over 600% following response to CPI report

Digital asset weekly inflows jump over 600% following response to CPI report

Coinshares weekly report of digital asset flows shows that crypto assets witnessed more than a 600% increase in net inflows last week after US Consumer Price Index saw a softer-than-expected inflation increase.

Read more

Will the commodity boom last?

Will the commodity boom last?

The gold and copper price both hit fresh record highs on Monday. The market is sensitive to these two metals because gold is considered an inflation hedge and a safe haven, and because copper is a metal that is linked to global growth.

Read more

Forex MAJORS

Cryptocurrencies

Signatures