USD/CHF Price Analysis: Double bottom in the hourly chart, targets 0.9970s
- The USD/CHF reclaims 0.9900, as a double bottom chart pattern, targets 0.9974.
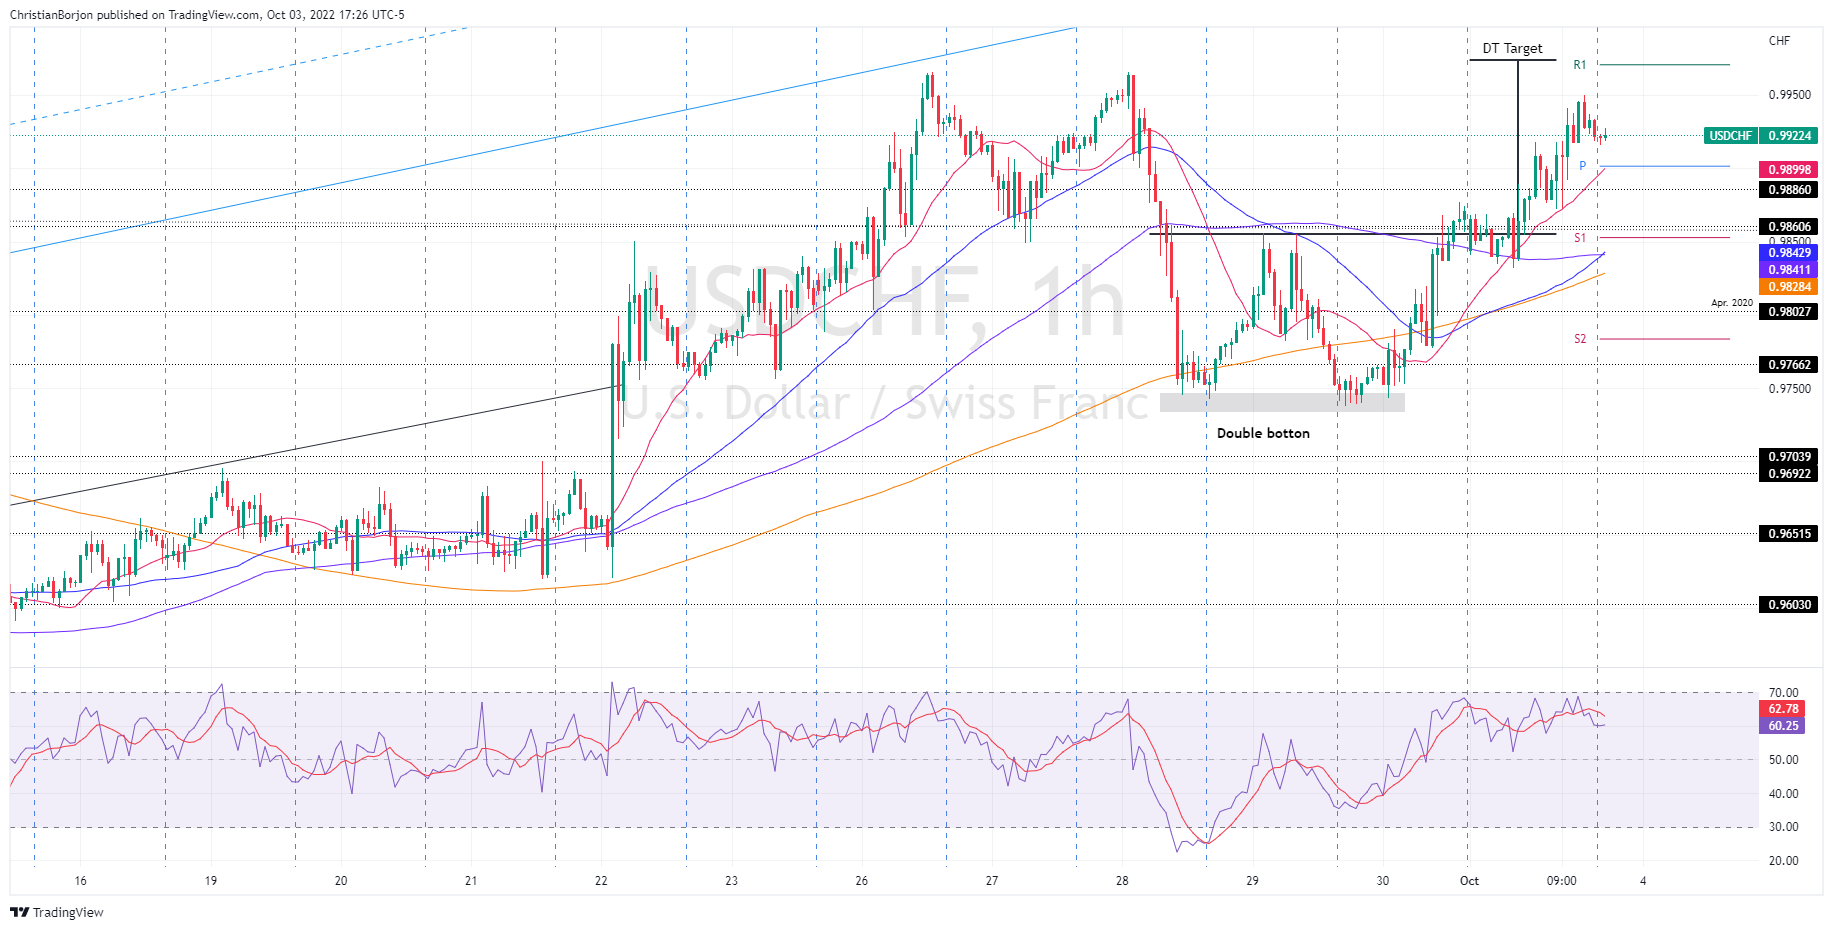
- Short term, the USD/CHF is neutral-to-downward biased, but it could reach the double bottom target before retracing towards the 20-EMA at 0.9899.

The USD/CHF is slightly down as the Asian Pacific session begins, though in the week it is gaining some 0.49%, after hitting a weekly high in the mid-0.99-1.00 range, due to improvement in sentiment; however, it retraced some to the current spot prices. At the time of writing, the USD/CHF is trading at 0.9922, down 0.01%.
USD/CHF Price Analysis: Technical outlook
From a daily chart perspective, the USD/CHF remains upward biased, though it failed to break above the September monthly high of 0.9966. It should be noted that the major has printed a higher low, but to continue its uptrend, it would need to clear September’s high to open the door for a parity re-test.
Since September 28, the USD/CHF bottomed around the 0.9740 area, forming a double bottom chart pattern. During Monday’s session, the USD/CHF decisively cleared the September 29 daily high at 0.9855, validating the pattern, which targets a rally towards 0.9974.
Therefore, the USD/CHF first resistance would be the October 3 high at 0.9966. Once cleared, the next resistance would be the double bottom target, at 0.9974, followed by the parity.
USD/CHF Key Technical Levels
Author

Christian Borjon Valencia
FXStreet
Markets analyst, news editor, and trading instructor with over 14 years of experience across FX, commodities, US equity indices, and global macro markets.


