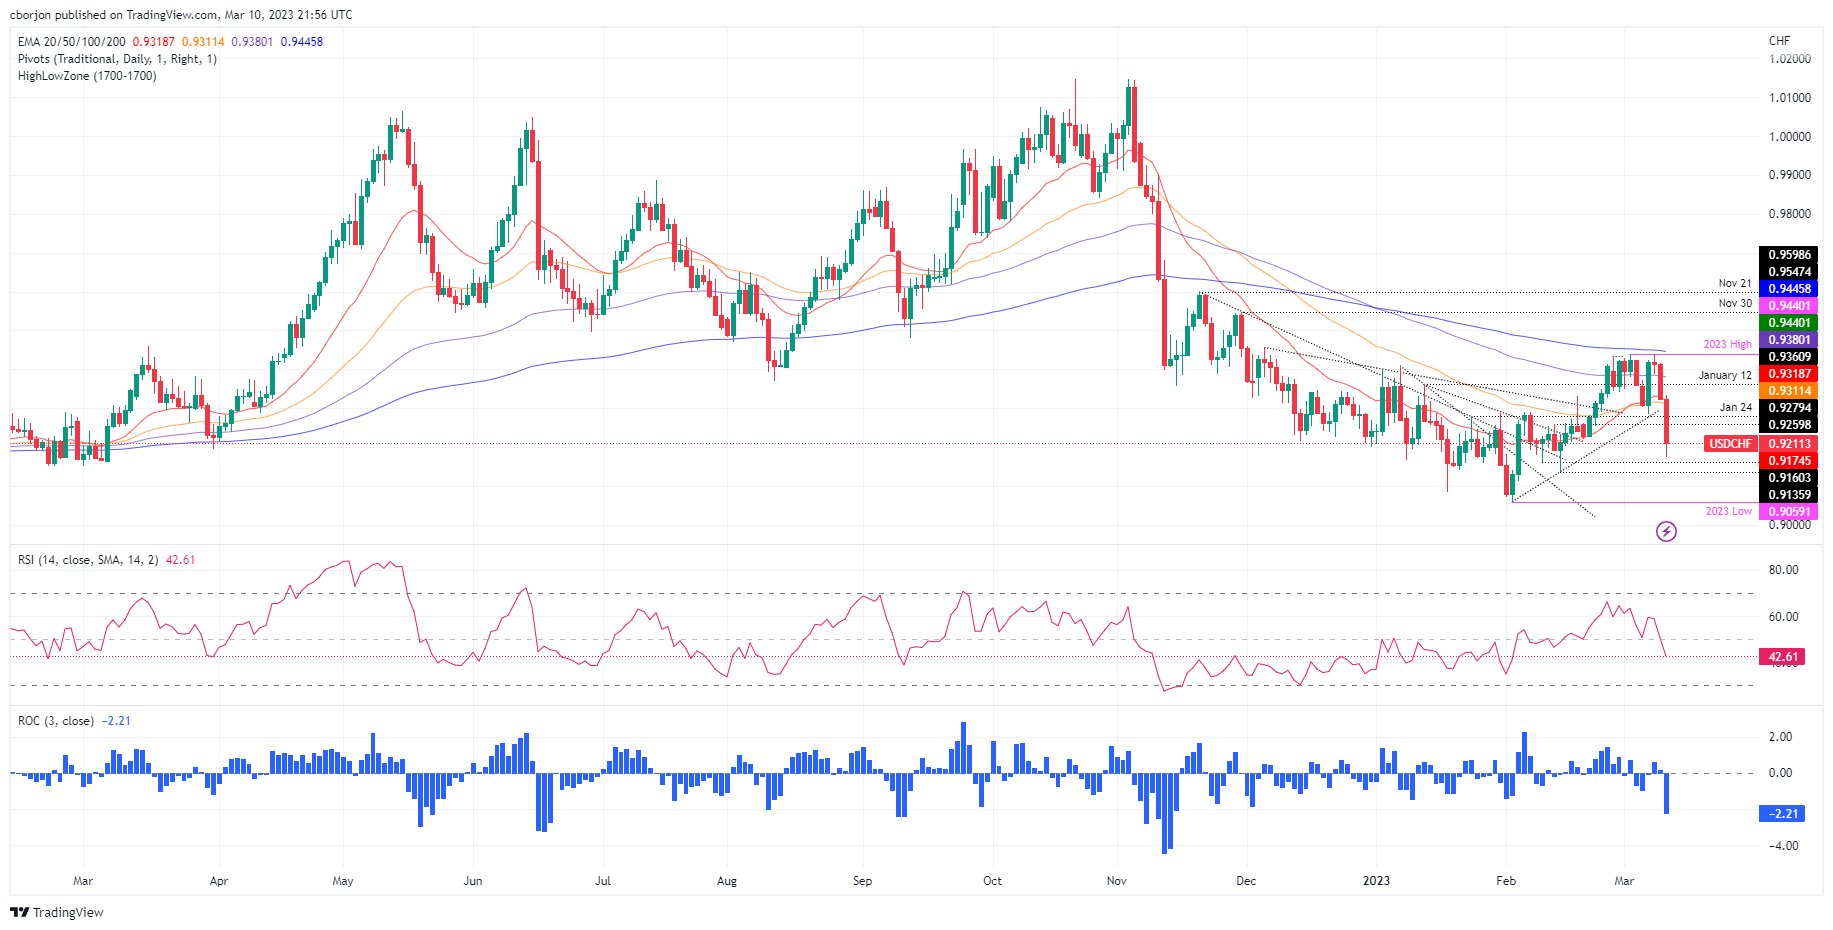
USD/CHF Price Analysis: Collapses below 20/50-DMAs once bears moved in at the 100-DMA


  • USD/CHF extended its drop past the 20/50-day EMAs after facing resistance at the 200-day EMA.
  • USD/CHF Price Forecast: Shifted bearish, though needs to crack 0.9130s to test YTD lows.

USD/CHF falls below the confluence of the 20 and 50-day Exponential Moving Averages (EMAs), extending its daily losses to more than 1% Friday. A mixed US jobs report weighed on the US Dollar (USD). Sentiment deteriorates on a US bank collapse, which could have spillover in the country. At the time of writing, the USD/CHF is trading at 0.9216.

USD/CHF Price Action

After dropping below the intersection of the 20 and 50-day EMAs, the USD/CHF shifted downwards. During the day, the pair reached a multi-week low of around 0.9174 before buyers stepped in and lifted the price above the 0.9200 figure.

With the Relative Strength Index (RSI) turning bearish and the Rate of Change (RoC) showing that sellers are gathering momentum, the USD/CHF path of least resistance is downwards.

That said, the USD/CHF pair's first support would be the 0.9200 figure. Once broken, the pair would test the March 10 low at 0.9174, followed by the February 14 swing low at 0.9140. A breach of the latter will expose the 0.9100 figure, followed by the YTD low at 0.9059.

In an alternate scenario, if the USD/CHF reclaims 0.9300, that would keep the bulls hopeful for testing the 0.9400 figure. However, buyers must conquer the 50 and 20-day EMAs at 0.9311 and 0.9319.

USD/CHF Daily Chart

USD/CHF Technical Levels

USD/CHF

Overview
Today last price 0.9214
Today Daily Change -0.0125
Today Daily Change % -1.34
Today daily open 0.9339
 
Trends
Daily SMA20 0.932
Daily SMA50 0.9267
Daily SMA100 0.941
Daily SMA200 0.9563
 
Levels
Previous Daily High 0.942
Previous Daily Low 0.9338
Previous Weekly High 0.944
Previous Weekly Low 0.9342
Previous Monthly High 0.9429
Previous Monthly Low 0.9059
Daily Fibonacci 38.2% 0.9369
Daily Fibonacci 61.8% 0.9388
Daily Pivot Point S1 0.9311
Daily Pivot Point S2 0.9284
Daily Pivot Point S3 0.923
Daily Pivot Point R1 0.9393
Daily Pivot Point R2 0.9447
Daily Pivot Point R3 0.9475


Share: Feed news

Information on these pages contains forward-looking statements that involve risks and uncertainties. Markets and instruments profiled on this page are for informational purposes only and should not in any way come across as a recommendation to buy or sell in these assets. You should do your own thorough research before making any investment decisions. FXStreet does not in any way guarantee that this information is free from mistakes, errors, or material misstatements. It also does not guarantee that this information is of a timely nature. Investing in Open Markets involves a great deal of risk, including the loss of all or a portion of your investment, as well as emotional distress. All risks, losses and costs associated with investing, including total loss of principal, are your responsibility. The views and opinions expressed in this article are those of the authors and do not necessarily reflect the official policy or position of FXStreet nor its advertisers. The author will not be held responsible for information that is found at the end of links posted on this page.

If not otherwise explicitly mentioned in the body of the article, at the time of writing, the author has no position in any stock mentioned in this article and no business relationship with any company mentioned. The author has not received compensation for writing this article, other than from FXStreet.

FXStreet and the author do not provide personalized recommendations. The author makes no representations as to the accuracy, completeness, or suitability of this information. FXStreet and the author will not be liable for any errors, omissions or any losses, injuries or damages arising from this information and its display or use. Errors and omissions excepted.

The author and FXStreet are not registered investment advisors and nothing in this article is intended to be investment advice.

Recommended content


Recommended content

Editors’ Picks

EUR/USD clings to daily gains above 1.0650

EUR/USD clings to daily gains above 1.0650

EUR/USD gained traction and turned positive on the day above 1.0650. The improvement seen in risk mood following the earlier flight to safety weighs on the US Dollar ahead of the weekend and helps the pair push higher.

EUR/USD News

GBP/USD recovers toward 1.2450 after UK Retail Sales data

GBP/USD recovers toward 1.2450 after UK Retail Sales data

GBP/USD reversed its direction and advanced to the 1.2450 area after touching a fresh multi-month low below 1.2400 in the Asian session. The positive shift seen in risk mood on easing fears over a deepening Iran-Israel conflict supports the pair.

GBP/USD News

Gold holds steady at around $2,380 following earlier spike

Gold holds steady at around $2,380 following earlier spike

Gold stabilized near $2,380 after spiking above $2,400 with the immediate reaction to reports of Israel striking Iran. Meanwhile, the pullback seen in the US Treasury bond yields helps XAU/USD hold its ground.

Gold News

Bitcoin Weekly Forecast: BTC post-halving rally could be partially priced in Premium

Bitcoin Weekly Forecast: BTC post-halving rally could be partially priced in

Bitcoin price shows no signs of directional bias while it holds above  $60,000. The fourth BTC halving is partially priced in, according to Deutsche Bank’s research. 

Read more

Week ahead – US GDP and BoJ decision on top of next week’s agenda

Week ahead – US GDP and BoJ decision on top of next week’s agenda

US GDP, core PCE and PMIs the next tests for the Dollar. Investors await BoJ for guidance about next rate hike. EU and UK PMIs, as well as Australian CPIs also on tap.

Read more

Forex MAJORS

Cryptocurrencies

Signatures