|

USD/CHF Price Analysis: Bumpy road for the bulls below 0.9000

  • USD/CHF buyers attack intraday top, near the highest in two months.
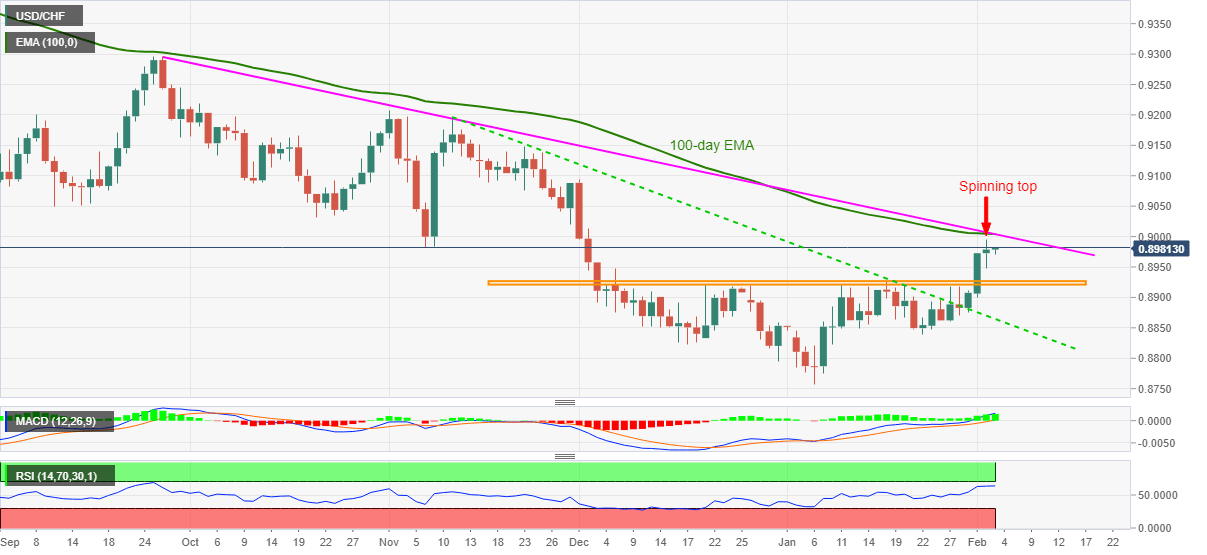
  • Tuesday’s spinning top candle, overbought RSI test upside ahead of 100-day EMA, four-month low resistance line.
  • Sellers need to wait for rejection of the inverse head-and-shoulders.

USD/CHF rises to 0.8981 during the pre-European session trading on Wednesday. In doing so, the quote stays positive around the December highs but the previous day’s play suggesting traders’ dilemma and higher levels of the RSI ahead of the key resistance confluence challenge the quote further upside.

However, the USD/CHF sellers are less likely to get convinced until witnessing a clear downside break of a two-month-old horizontal area, part of a bullish chart pattern, near 0.8920.

Also acting as the support is the previous resistance line stretched from November 11, at 0.8864 now.

Meanwhile, a confluence of 100-day EMA and a downward sloping trend line from late September around 0.9000 becomes the key resistance to crack for USD/CHF buyers.

Following that, an upward trajectory towards the November 2020 peak surrounding 0.9200 can’t be ruled out.

USD/CHF daily chart
Trend: Pullback expected

Additional important levels

Overview
Today last price0.8982
Today Daily Change3 pips
Today Daily Change %0.03%
Today daily open0.8979
 
Trends
Daily SMA200.8884
Daily SMA500.8896
Daily SMA1000.9017
Daily SMA2000.9201
 
Levels
Previous Daily High0.8995
Previous Daily Low0.8947
Previous Weekly High0.8919
Previous Weekly Low0.8848
Previous Monthly High0.8926
Previous Monthly Low0.8758
Daily Fibonacci 38.2%0.8977
Daily Fibonacci 61.8%0.8966
Daily Pivot Point S10.8952
Daily Pivot Point S20.8925
Daily Pivot Point S30.8904
Daily Pivot Point R10.9
Daily Pivot Point R20.9022
Daily Pivot Point R30.9049

Author

Anil Panchal

Anil Panchal

FXStreet

Anil Panchal has nearly 15 years of experience in tracking financial markets. With a keen interest in macroeconomics, Anil aptly tracks global news/updates and stays well-informed about the global financial moves and their implications.


More from Anil Panchal
Share:

Editor's Picks

GBP/USD remains offered; bears target 1.3600

GBP/USD now leaves behind part of its recent recovery and revisits the low 1.3600s at the beginning of the week. Indeed, Cable trades with a mild downward bias amid decent gains in the Greenback as investors remain wary of upcoming US data releases and the Jackson Hole event.

EUR/USD remains sidelined above 1.1650

EUR/USD trades on the defensive following the closing bell on Wall Street on Monday, hovering around the 1.1660 region and adding to Friday’s small decline. The pair’s pullback comes in response to an acceptable rebound in the US Dollar in a context of generalised caution ahead of key US data releases and Chair Warsh’s speech in Jackson Hole.

Gold poised to extend its bullish run

Gold surrenders part of its initial advance, although it keeps its bullish pace well and sound above the $4,600 mark per troy ounce on Monday. The precious metal’s move higher comes despite slight gains in the US Dollar and a modest pullback in US Treasury yields across the curve.

XRP surged 72%, but is the rally really about XRP?
Ripple (XRP) surged more than 72% in less than a week, its strongest rally since July 2025, as cryptocurrency prices broadly broke out. But the move has a problem: it may have little to do with XRP itself. The token's near-term rally appears to have been driven largely by a broader liquidity shift after the US Treasury expanded long-end bond buybacks, pulling yields lower and lifting risk assets.
Convulsion in credit markets
The United States government just posted a $432.3 billion deficit for July, the largest monthly shortfall since March of 2021. That single burst of red ink pushed the yeartodate deficit to $1.8 trillion, with two months still remaining in fiscal 2026. At this pace, Washington will soon wax nostalgic for the “good old days” when annual deficits were only $2 trillion.
$20 billion offered, $2 billion taken: Why Treasury doubled its buyback cap

The US Treasury moved off its own calendar on Wednesday, and that is the part worth sitting with. At 12:32 GMT, the department said it would at least double the size of liquidity support buyback operations in the 10-year to 20-year and 20-year to 30-year sectors, lifting the maximum from $2 billion per operation to at least $4 billion, effective September 9 and running to November 4.















