USD/CHF Price Analysis: Bears eye sub-0.9200 zone on breaking immediate support line


  • USD/CHF takes offers to refresh intraday bottom, fades bounce off nine-month low.
  • Downside break of weekly support line, bear cross underpin downside bias.
  • Recovery moves remain elusive unless crossing 0.9275 hurdle.

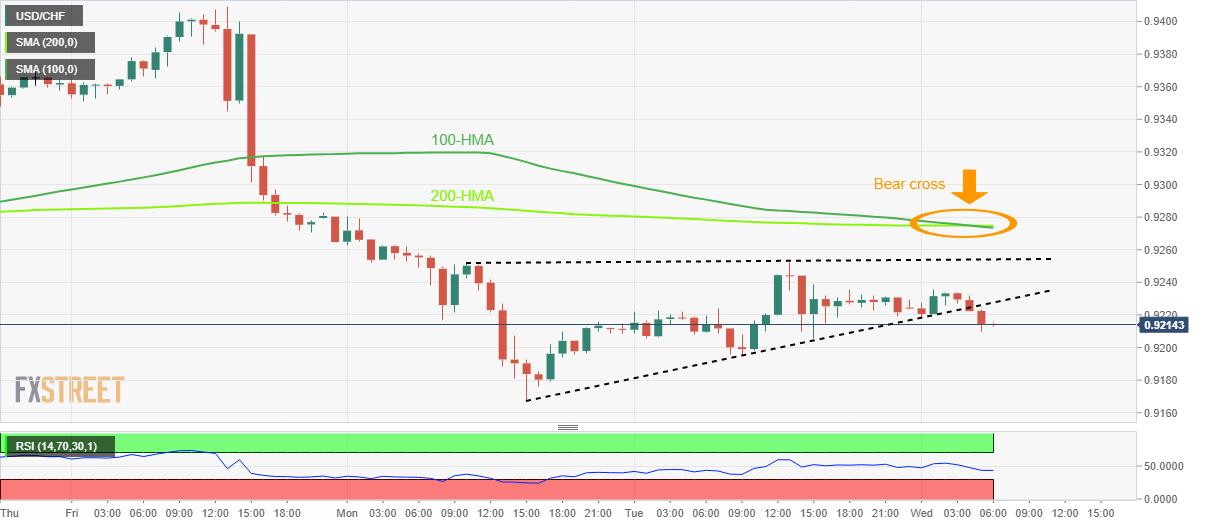
USD/CHF breaks an upward-sloping trend line to welcome bears after the previous day’s brief absence. That said, the Swiss Franc (CHF) pair renews its intraday low around 0.9210 during the early hours of Wednesday morning in Europe.

In addition to the downside break of the two-day-old support line, USD/CHF also cheers bear cross of the key moving averages on the hourly format. The bearish moving average crossover could be witnessed as the 100-Hour Moving Average (HMA) slips beneath the 200-HMA.

It's worth noting that an absence of oversold RSI also signals a smooth road to the south for the pair sellers.

As a result, the USD/CHF pair is all set to revisit the monthly low surrounding 0.9165, which is also the lowest level since March 2022.

In a case where the bears keep reins past 0.9165, the 0.9100 round figure and the previous yearly low around 0.9090 will gain the market’s attention.

On the contrary, the support-turned-resistance line stretched from Monday, around 0.9230 by the press time, guards immediate recovery of the USD/CHF pair.

Following that, a three-day-old trend line resistance near 0.9255 could test the pair buyers.

However, the USD/CHF bulls may remain cautious unless witnessing a clear upside break of the key HMA convergence surrounding 0.9275.

USD/CHF: Hourly chart

Trend: Further downside expected

Additional important levels

Overview
Today last price 0.9214
Today Daily Change -0.0014
Today Daily Change % -0.15%
Today daily open 0.9228
 
Trends
Daily SMA20 0.9286
Daily SMA50 0.9443
Daily SMA100 0.9635
Daily SMA200 0.9644
 
Levels
Previous Daily High 0.9252
Previous Daily Low 0.9195
Previous Weekly High 0.941
Previous Weekly Low 0.9223
Previous Monthly High 0.9471
Previous Monthly Low 0.9201
Daily Fibonacci 38.2% 0.923
Daily Fibonacci 61.8% 0.9217
Daily Pivot Point S1 0.9198
Daily Pivot Point S2 0.9168
Daily Pivot Point S3 0.9141
Daily Pivot Point R1 0.9255
Daily Pivot Point R2 0.9282
Daily Pivot Point R3 0.9312


Share: Feed news

Information on these pages contains forward-looking statements that involve risks and uncertainties. Markets and instruments profiled on this page are for informational purposes only and should not in any way come across as a recommendation to buy or sell in these assets. You should do your own thorough research before making any investment decisions. FXStreet does not in any way guarantee that this information is free from mistakes, errors, or material misstatements. It also does not guarantee that this information is of a timely nature. Investing in Open Markets involves a great deal of risk, including the loss of all or a portion of your investment, as well as emotional distress. All risks, losses and costs associated with investing, including total loss of principal, are your responsibility. The views and opinions expressed in this article are those of the authors and do not necessarily reflect the official policy or position of FXStreet nor its advertisers. The author will not be held responsible for information that is found at the end of links posted on this page.

If not otherwise explicitly mentioned in the body of the article, at the time of writing, the author has no position in any stock mentioned in this article and no business relationship with any company mentioned. The author has not received compensation for writing this article, other than from FXStreet.

FXStreet and the author do not provide personalized recommendations. The author makes no representations as to the accuracy, completeness, or suitability of this information. FXStreet and the author will not be liable for any errors, omissions or any losses, injuries or damages arising from this information and its display or use. Errors and omissions excepted.

The author and FXStreet are not registered investment advisors and nothing in this article is intended to be investment advice.

Recommended content


Recommended content

Editors’ Picks

EUR/USD edges lower toward 1.0700 post-US PCE

EUR/USD edges lower toward 1.0700 post-US PCE

EUR/USD stays under modest bearish pressure but manages to hold above 1.0700 in the American session on Friday. The US Dollar (USD) gathers strength against its rivals after the stronger-than-forecast PCE inflation data, not allowing the pair to gain traction.

EUR/USD News

GBP/USD retreats to 1.2500 on renewed USD strength

GBP/USD retreats to 1.2500 on renewed USD strength

GBP/USD lost its traction and turned negative on the day near 1.2500. Following the stronger-than-expected PCE inflation readings from the US, the USD stays resilient and makes it difficult for the pair to gather recovery momentum.

GBP/USD News

Gold struggles to hold above $2,350 following US inflation

Gold struggles to hold above $2,350 following US inflation

Gold turned south and declined toward $2,340, erasing a large portion of its daily gains, as the USD benefited from PCE inflation data. The benchmark 10-year US yield, however, stays in negative territory and helps XAU/USD limit its losses. 

Gold News

Bitcoin Weekly Forecast: BTC’s next breakout could propel it to $80,000 Premium

Bitcoin Weekly Forecast: BTC’s next breakout could propel it to $80,000

Bitcoin’s recent price consolidation could be nearing its end as technical indicators and on-chain metrics suggest a potential upward breakout. However, this move would not be straightforward and could punish impatient investors. 

Read more

Week ahead – Hawkish risk as Fed and NFP on tap, Eurozone data eyed too

Week ahead – Hawkish risk as Fed and NFP on tap, Eurozone data eyed too

Fed meets on Wednesday as US inflation stays elevated. Will Friday’s jobs report bring relief or more angst for the markets? Eurozone flash GDP and CPI numbers in focus for the Euro.

Read more

Forex MAJORS

Cryptocurrencies

Signatures