- USD/CHF grinds higher after taking a U-turn from the key EMA, horizontal support.
- 50% Fibonacci retracement of January-May upside guards recovery moves.
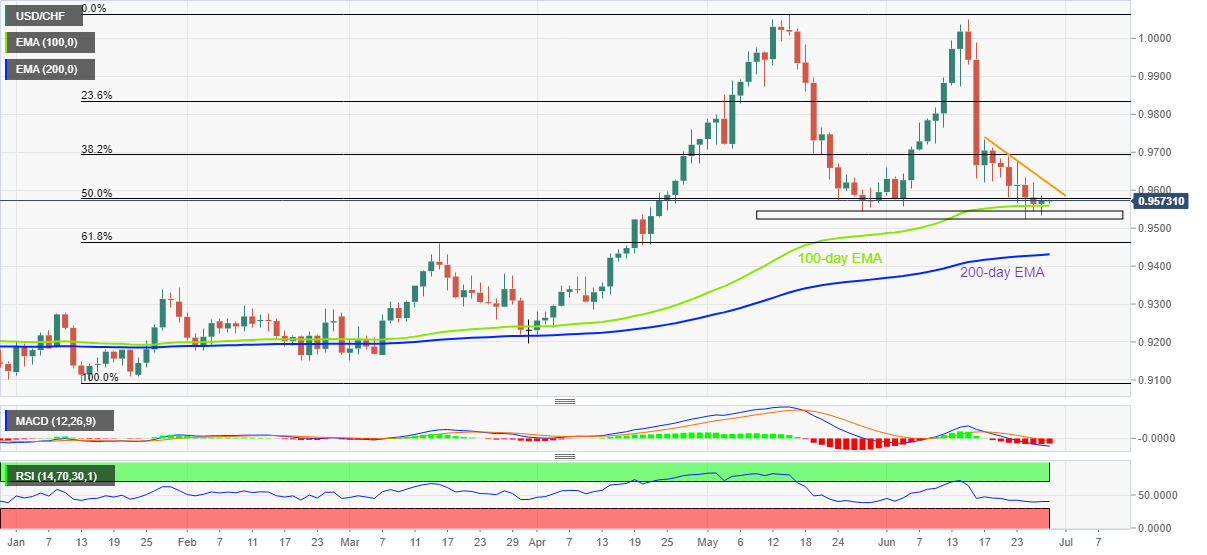
- Descending RSI line, bearish MACD signals challenge buyers, eight-day-old resistance line adds to the upside filters.
USD/CHF holds onto the previous day’s bounce off the 100-day EMA around 0.9575 during Wednesday’s initial Asian session. In doing so, the Swiss currency (CHF) pair jostles with the 50% Fibonacci retracement (Fibo.) of its January-May upside.
Although monthly horizontal support near 0.9520-45 adds strength to the downside filters, descending RSI (14) line, not oversold, joins the bearish MACD signals to hint at the USD/CHF pair buyer's hardships.
That said, a weekly resistance line near 0.9620 also challenges the short-term USD/CHF recovery, apart from the 50% Fibo. level of 0.9578.
Even if the quote rises past 0.9620, the 0.9700 round figure and multiple hurdles surrounding 0.9715 may test the bulls before giving them control.
On the contrary, a downside break of the 0.9520 support could direct the USD/CHF sellers towards the 61.8% Fibonacci retracement level near 0.9465.
Following that, the 200-day EMA level of 0.9430 will challenge the pair’s further downside, a break of which won’t hesitate to direct the quote towards January’s high near 0.9345.
USD/CHF: Daily chart
Trend: Limited upside expected
Information on these pages contains forward-looking statements that involve risks and uncertainties. Markets and instruments profiled on this page are for informational purposes only and should not in any way come across as a recommendation to buy or sell in these assets. You should do your own thorough research before making any investment decisions. FXStreet does not in any way guarantee that this information is free from mistakes, errors, or material misstatements. It also does not guarantee that this information is of a timely nature. Investing in Open Markets involves a great deal of risk, including the loss of all or a portion of your investment, as well as emotional distress. All risks, losses and costs associated with investing, including total loss of principal, are your responsibility. The views and opinions expressed in this article are those of the authors and do not necessarily reflect the official policy or position of FXStreet nor its advertisers. The author will not be held responsible for information that is found at the end of links posted on this page.
If not otherwise explicitly mentioned in the body of the article, at the time of writing, the author has no position in any stock mentioned in this article and no business relationship with any company mentioned. The author has not received compensation for writing this article, other than from FXStreet.
FXStreet and the author do not provide personalized recommendations. The author makes no representations as to the accuracy, completeness, or suitability of this information. FXStreet and the author will not be liable for any errors, omissions or any losses, injuries or damages arising from this information and its display or use. Errors and omissions excepted.
The author and FXStreet are not registered investment advisors and nothing in this article is intended to be investment advice.
Recommended content
Editors’ Picks
EUR/USD holds below 1.0750 ahead of key US data

EUR/USD trades in a tight range below 1.0750 in the European session on Friday. The US Dollar struggles to gather strength ahead of key PCE Price Index data, the Fed's preferred gauge of inflation, and helps the pair hold its ground.
GBP/USD consolidates above 1.2500, eyes on US PCE data

GBP/USD fluctuates at around 1.2500 in the European session on Friday following the three-day rebound. The PCE inflation data for March will be watched closely by market participants later in the day.
Gold clings to modest daily gains at around $2,350

Gold stays in positive territory at around $2,350 after closing in positive territory on Thursday. The benchmark 10-year US Treasury bond yield edges lower ahead of US PCE Price Index data, allowing XAU/USD to stretch higher.
Bitcoin Weekly Forecast: BTC’s next breakout could propel it to $80,000 Premium

Bitcoin’s recent price consolidation could be nearing its end as technical indicators and on-chain metrics suggest a potential upward breakout. However, this move would not be straightforward and could punish impatient investors.
US core PCE inflation set to signal firm price pressures as markets delay Federal Reserve rate cut bets

The core PCE Price Index, which excludes volatile food and energy prices, is seen as the more influential measure of inflation in terms of Fed positioning. The index is forecast to rise 0.3% on a monthly basis in March, matching February’s increase.