- The US Dollar waffled against the Swiss Franc on Friday, stuck near the 0.8820 level.
- The USD/CHF is on pace to drop back into the 0.8800 handle.
- Next week sees US GDP and CPI inflation numbers.
The USD/CHF tracked lower on Friday as broader markets saw an uptick in risk appetite to close out the trading week, bringing the US Dollar (USD) down into familiar lows against the Swiss Franc (CHF) with the 0.8800 handle in full view.
The pair traded mostly flat for the week with a brief push into a high of 0.8874 while Friday saw the week's low etched in at 0.8811.
Next week sees a relatively sedate economic calendar before high-impact US data hits markets in the mid-week, with US Gross Domestic Product (GDP) scheduled for Wednesday and Personal Consumption Expenditure (PCE) inflation figures slated for Thursday.
An array of US market data due in the latter half of next week
Annualized US quarterly GDP is expected to tick upwards slightly from 4.9% to 5.0%, and US PCE for the month of October is forecast to drop slightly from 0.3% to 0.2%.
Next week will close out market action with Swiss quarterly GDP and US ISM Purchasing Managers' Index (PMI) numbers both slated for Friday, December 1st.
Swiss GDP is broadly expected to hold flat for the third quarter at 0.0%, while the US ISM Manufacturing PMI for November is forecast to tick upwards from 46.7 to 47.6.
Federal Reserve (Fed) Chairman Jerome Powell will also be making an appearance next Friday. The head of the Fed will be participating in an informal discussion labeled "Navigating Pathways to Economic Mobility" at the Spelman College of Atlanta.
USD/CHF Technical Outlook
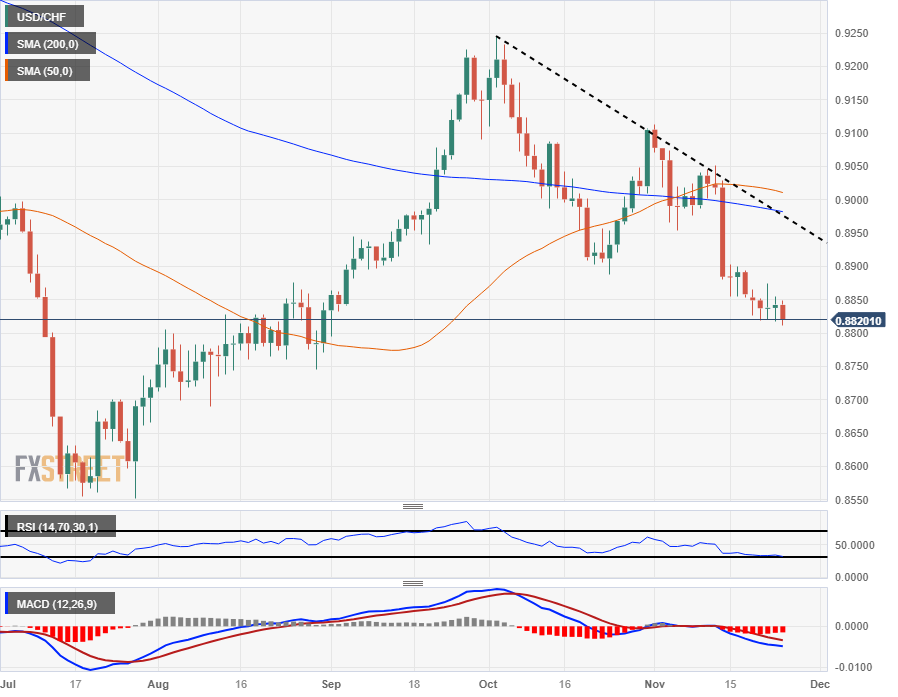
The USD/CHF's Friday dip sets the pair up for a fresh downside run at the 0.8800 handle, and technical support is looking thin in the near-term, with the nearest firm barrier seen at July's low bids near 0.8550.
On the top end, a series of lower highs is drawing in a descending trendline from October's early swing high into 0.9250, which looks set to provide technical resistance looking ahead.
The 200-day Simple Moving Average (SMA) is trending down below just below the major 0.9000 handle, capping off any strong topside bullish recoveries, while the 50-day SMA is rotating into a bearish stance from just above 0.9000.
USD/CHF Daily Chart
USD/CHF Technical Levels
Information on these pages contains forward-looking statements that involve risks and uncertainties. Markets and instruments profiled on this page are for informational purposes only and should not in any way come across as a recommendation to buy or sell in these assets. You should do your own thorough research before making any investment decisions. FXStreet does not in any way guarantee that this information is free from mistakes, errors, or material misstatements. It also does not guarantee that this information is of a timely nature. Investing in Open Markets involves a great deal of risk, including the loss of all or a portion of your investment, as well as emotional distress. All risks, losses and costs associated with investing, including total loss of principal, are your responsibility. The views and opinions expressed in this article are those of the authors and do not necessarily reflect the official policy or position of FXStreet nor its advertisers. The author will not be held responsible for information that is found at the end of links posted on this page.
If not otherwise explicitly mentioned in the body of the article, at the time of writing, the author has no position in any stock mentioned in this article and no business relationship with any company mentioned. The author has not received compensation for writing this article, other than from FXStreet.
FXStreet and the author do not provide personalized recommendations. The author makes no representations as to the accuracy, completeness, or suitability of this information. FXStreet and the author will not be liable for any errors, omissions or any losses, injuries or damages arising from this information and its display or use. Errors and omissions excepted.
The author and FXStreet are not registered investment advisors and nothing in this article is intended to be investment advice.
Recommended content
Editors’ Picks

EUR/USD holds on to gains near fresh 2025 highs
The EUR/USD holds near the fresh 2025 peak in the 1.1640 area, as optimism about a truce in the Middle East keeps fueling demand for high-yielding assets. Powell’s testimony before Congress did not help the US Dollar.

Gold stabilized around $3,310 as mood remains upbeat
The bright metal briefly traded below $3,300 on Tuesday, as market players welcomed a de-escalation in the Middle East conflict. Hawkish remarks from Fed Chair Powell added to the upbeat mood.

Three signs altcoin season is dead and traders are betting on top 3 cryptos
The altcoin season is a time period during which 75% of the altcoins ranked in the top 50 cryptos by market capitalization outperform Bitcoin in a 90-day timeframe. Traders await the altcoin season every market cycle to take profits on alternative tokens as capital rotates from Bitcoin to other cryptos.

Could Iran block the Strait of Hormuz? Why Oil is on edge after US strikes
As the Israel-Iran conflict reaches new heights, an old threat is coming back to haunt the markets: that of the closure of the Strait of Hormuz. This narrow arm of the sea in the Persian Gulf, wedged between Iran to the north and the United Arab Emirates and Oman to the south, is much more than a simple sea passage.

The Best brokers to trade EUR/USD
SPONSORED Discover the top brokers for trading EUR/USD in 2025. Our list features brokers with competitive spreads, fast execution, and powerful platforms. Whether you're a beginner or an expert, find the right partner to navigate the dynamic Forex market.