USD/CAD Technical Analysis: Struggles between 100/200-day EMA
- USD/CAD struggles for direction inside key EMAs.
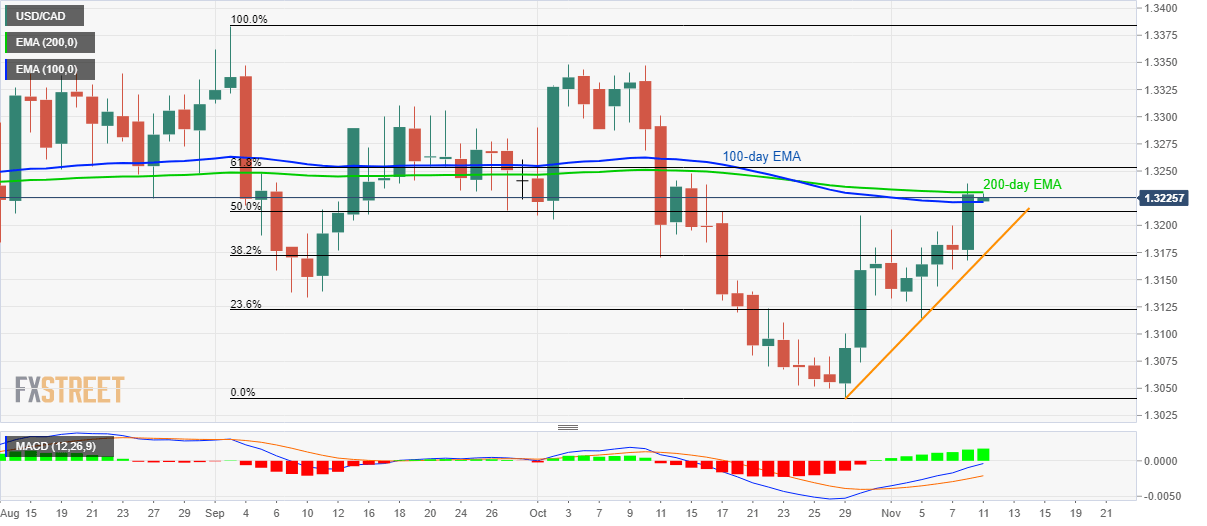
- Bullish MACD keeps buyers hopeful to challenge 61.8% Fibonacci retracement.
- 1.3175/70 becomes an important support confluence.

Despite rising to the mid-October highs, USD/CAD fails to extend its run-up beyond 200-day EMA as it trades near 1.3225 during the Asian session on Monday.
While bullish signals from 12-bar Moving Average Convergence and Divergence (MACD) portrays the strength of upside momentum, sellers seek a daily closing below 100-day Exponential Moving Average (EMA) level of 1.3220 to aim for 1.3200 round-figure.
However, a rising trend line since late-October and 38.2% Fibonacci retracement of September-October declines could keep the pair’s further declines limited around 1.3175/70.
On the upside, pair’s sustained trading beyond a 200-day EMA level of 1.3230 could challenge 61.8% Fibonacci retracement level of 1.3255.
In a case where bulls keep dominating past-1.3255, 1.3300 and October month top surrounding 1.3350 will become their favorites.
USD/CAD daily chart
Trend: sideways
Author

Anil Panchal
FXStreet
Anil Panchal has nearly 15 years of experience in tracking financial markets. With a keen interest in macroeconomics, Anil aptly tracks global news/updates and stays well-informed about the global financial moves and their implications.


