|

USD/CAD technical analysis: Buyers attempt comeback from 4H 200MA, multi-day old support-line

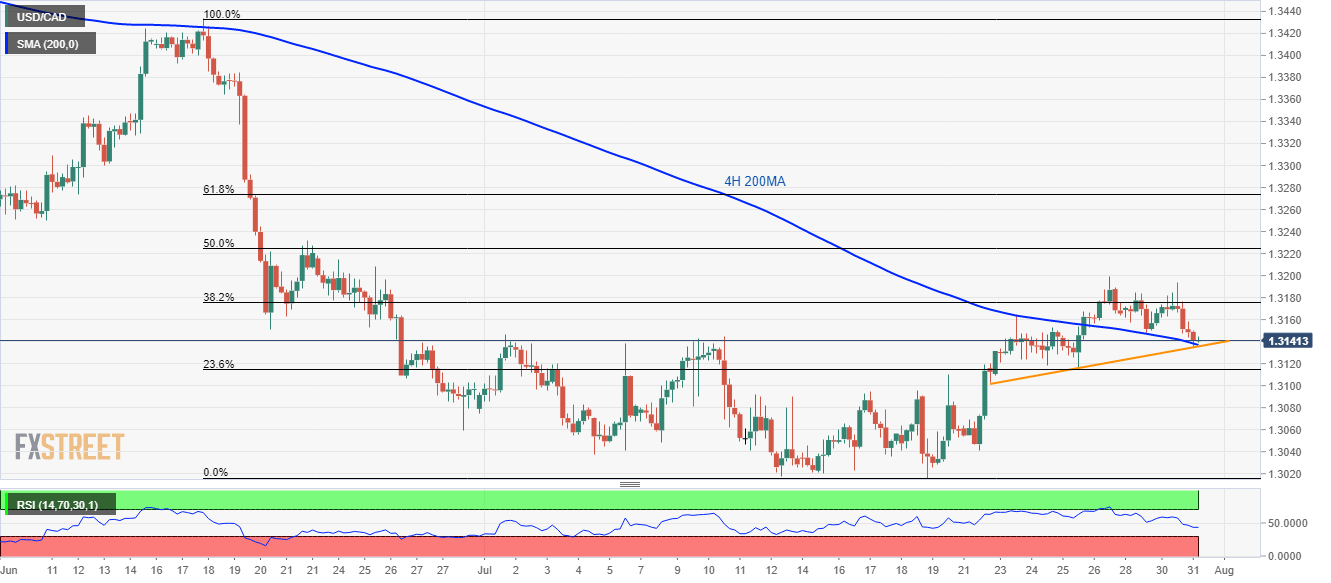
  • USD/CAD nears the short-term key supports comprising 4H 200MA and a week-long ascending trend-line.
  • 1.3200 seems to be the crucial resistance to watch during the upside.

Failure to cross 1.3200 couldn’t bode well for sellers as USD/CAD stops declining around key short-term support confluence while making the rounds to 1.3140 during early Wednesday.

200-bar moving average on the 4-hour chart (4H 200MA) and seven-day-old ascending trend-line portrays 1.3135/37 as the key support area that buyers can avail to register a bounce towards 38.2% Fibonacci retracement of June-July downpour, at 1.3175 and then target 1.3200 round-figure.

Should there be additional rise past-1.3200, June 21 top near 1.3230 and 61.8% Fibonacci retracement near 1.3275 may lure the bulls.

Alternatively, a downside break of 1.3135 can take rest on 23.6% Fibonacci retracement level of 1.3115 whereas 1.3100 and month’s low near 1.3016 might please sellers afterward.

Adding to note is declining 14-bar relative strength index (RSI) that can trigger the pullback if being oversold around the supports.

USD/CAD 4-hour chart

Trend: Pullback expected

    1. R3 1.3232 
    2. R2 1.3213 
    3. R1 1.3182 
  1. PP 1.3163 
    1. S1 1.3132 
    2. S2 1.3112 
    3. S3 1.3082

Author

Anil Panchal

Anil Panchal

FXStreet

Anil Panchal has nearly 15 years of experience in tracking financial markets. With a keen interest in macroeconomics, Anil aptly tracks global news/updates and stays well-informed about the global financial moves and their implications.

More from Anil Panchal
Share:

Editor's Picks

EUR/USD treads water above 1.1850 amid thin trading

EUR/USD stays defensive but holds 1.1850 amid quiet markets in the European hours on Monday.  The US Dollar is struggling for direction due to thin liquidity conditions as US markets are closed in observance of Presidents' Day. 

GBP/USD flat lines as traders await key UK and US macro data

GBP/USD kicks off a new week on a subdued note and oscillates in a narrow range near 1.365 in Monday's European trading. The mixed fundamental backdrop warrants some caution for aggressive traders as the market focus now shifts to this week's important releases from the UK and the US.

Gold sticks to intraday losses; lacks follow-through

Gold remains depressed through the early European session on Monday, though it has managed to rebound from the daily trough and currently trades around the $5,000 psychological mark. Moreover, a combination of supporting factors warrants some caution for aggressive bearish traders, and before positioning for deeper losses.

Bitcoin, Ethereum and Ripple consolidate within key ranges as selling pressure eases

Bitcoin and Ethereum prices have been trading sideways within key ranges following the massive correction. Meanwhile, XRP recovers slightly, breaking above the key resistance zone. The top three cryptocurrencies hint at a potential short-term recovery, with momentum indicators showing fading bearish signs.

Global inflation watch: Signs of cooling services inflation

Realized inflation landed close to expectations in January, as negative base effects weighed on the annual rates. Remaining sticky inflation is largely explained by services, while tariff-driven goods inflation remains limited even in the US.

Ripple Price Forecast: XRP potential bottom could be in sight

Ripple edges up above the intraday low of $1.35 at the time of writing on Friday amid mixed price actions across the crypto market. The remittance token failed to hold support at $1.40 the previous day, reflecting risk-off sentiment amid a decline in retail and institutional sentiment.