|

USD/CAD recovers from Friday's lows to inch closer towards 1.35

  • The USD/CAD is recovering for Friday after slipping to 1.3425.
  • Rising oil prices are bolstering the CAD, but the USD has been finding market support.
  • Canadian Retail Sales rose for July, but slightly less than expected, reducing CAD upside.

The USD/CAD is set to finish out Friday near where it started, trading just south of 1.3490.

The Loonie (CAD) has twisted through the back half of the trading week, with the CAD and (Greenback) playing tug-of-war.

Rising oil prices have been boosting the CAD lately, but a break in crude gains sees the USD/CAD testing back into recovery territory.

Canadian Retail Sales rose 0.3% in July, slightly below market expectations of 0.4% but an improvement on the previous month's -0.7%, which was revised upwards from -0.8%.

Core Retail Sales (retail sales figures less automobiles) rose 1% for the same period, breezing past analyst forecasts of 0.5%.

On the US side, Purchasing Manager Index (PMI) figures came in mixed, seeing a brief slip in the US Dollar but capping off the potential for a determined move in either direction for the USD.

The preliminary US S&P Global Manufacturing PMI for September climbed to 48.9 against the expected 48, easily clearing expectations. The Services PMI component slipped analyst forecasts, dipping to 50.2 and reversing the expected improvement to 50.6.

Read more: 

US S&P Global Manufacturing PMI improves to 48.9, Services PMI declines to 50.2 in September

The economic calendar is on the thin side for next week, but investors will be keeping one eye out for US Durable Goods Orders next Wednesday. Markets are expecting durable goods orders for August to print at -0.4%, a declining figure but still an improvement from the previous period's 5.2% decline.

USD/CAD technical outlook

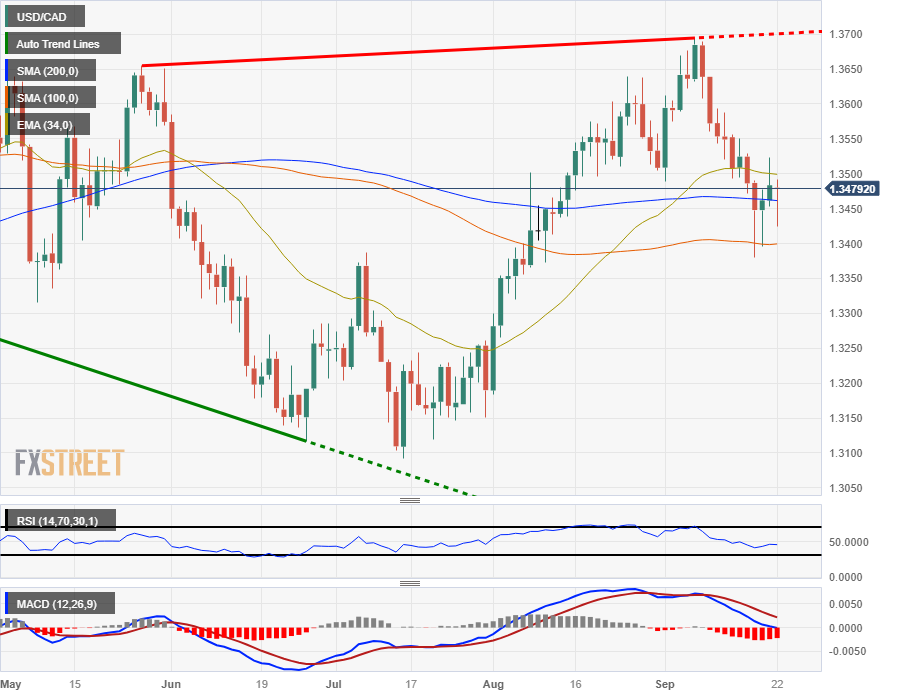
The USD/CAD is trying to recover from near-term lows into 1.3380, and is seeing the 200-hour Simple Moving Average (SMA), currently capping off intraday action from 1.3500.

The pair is 1.6% down from September's peak just below the 1.3700 handle.

Daily candlesticks sees the USD/CAD stuck into the 200-day SMA, and market sentiment could flow in either direction moving forward.

USD/CAD daily chart

USD/CAD technical levels

USD/CAD

Overview
Today last price1.3479
Today Daily Change-0.0005
Today Daily Change %-0.04
Today daily open1.3484
 
Trends
Daily SMA201.3558
Daily SMA501.3436
Daily SMA1001.3398
Daily SMA2001.3463
 
Levels
Previous Daily High1.3524
Previous Daily Low1.3453
Previous Weekly High1.3639
Previous Weekly Low1.3493
Previous Monthly High1.364
Previous Monthly Low1.3184
Daily Fibonacci 38.2%1.3497
Daily Fibonacci 61.8%1.348
Daily Pivot Point S11.345
Daily Pivot Point S21.3416
Daily Pivot Point S31.3379
Daily Pivot Point R11.352
Daily Pivot Point R21.3558
Daily Pivot Point R31.3591

Author

Joshua Gibson

Joshua joins the FXStreet team as an Economics and Finance double major from Vancouver Island University with twelve years' experience as an independent trader focusing on technical analysis.

More from Joshua Gibson
Share:

Editor's Picks

EUR/USD slumps below 1.1750 as USD benefits from risk-aversion

EUR/USD comes under renewed bearish pressure in the European session and trades below 1.1750 following a recovery attempt earlier in the day. The US Dollar gathers strength and weighs on the pair as investors seek refuge in the wake of Israel and the United States' joint attack on Iran.

GBP/USD targets 1.3500 barrier near moving averages

GBP/USD rebounds from the daily losses, trading around 1.3450 during the Asian hours on Monday. The technical analysis of the daily chart indicates an ongoing bearish bias, as the pair trades within a descending channel pattern.

Gold surges on safe-haven demand, closes in on $5,400

Gold benefits from intense risk-aversion on Monday and climbs toward $5,400, setting a fresh monthly-high in the process. Tensions in the Middle East remain high as Israel and Hezbollah continue to exchange strikes following the US-Israel joint attack on Iran over the weekend.

Bitcoin, Ethereum and Ripple under pressure as key supports face breakdown risk

Bitcoin, Ethereum, and Ripple prices trade on the back foot at the start of this week on Monday, after extending losses in the previous week. BTC is on the brink of a breakdown, ETH is capped below key resistance, and XRP risks a crack of the trendline.

The market is paying for insurance, not apocalypse

As expected, this morning felt less like a Monday market open and more like a fire drill. Futures screens flickered red. S&P contracts down almost 1%. Nasdaq off 1.2%. Brent leaped 13% through $80. Gold rose 1.6% toward $5350 before paring some gains. The dollar is strutting mildly. The Swiss franc is quietly doing what it always does in a storm, catching some safe-haven flows.

Starknet unveils strkBTC, shielded Bitcoin transactions on Ethereum Layer 2

Starknet, the Ethereum Layer 2 network developed by StarkWare, today announced strkBTC, a wrapped Bitcoin asset that introduces optional shielding while preserving full DeFi composability.