|

USD/CAD Price Forecast: Down leg unfolding within long-term range

  • USD/CAD is declining within a large range. 
  • The Loonie will probably fall to the range lows or an interim target. 
  • The RSI is oversold indicating a risk of a reaction, although no signal has been given yet. 

USD/CAD is currently declining within a long-term range which has a ceiling in the 1.39s and a floor in the 1.31-1.32s. 

The pair is unfolding a down leg within this range as the US Dollar (USD) weakens. Both the medium and short-term trends are now bearish, which given “the trend is your friend” favors short positions over longs. 

USD/CAD Daily Chart

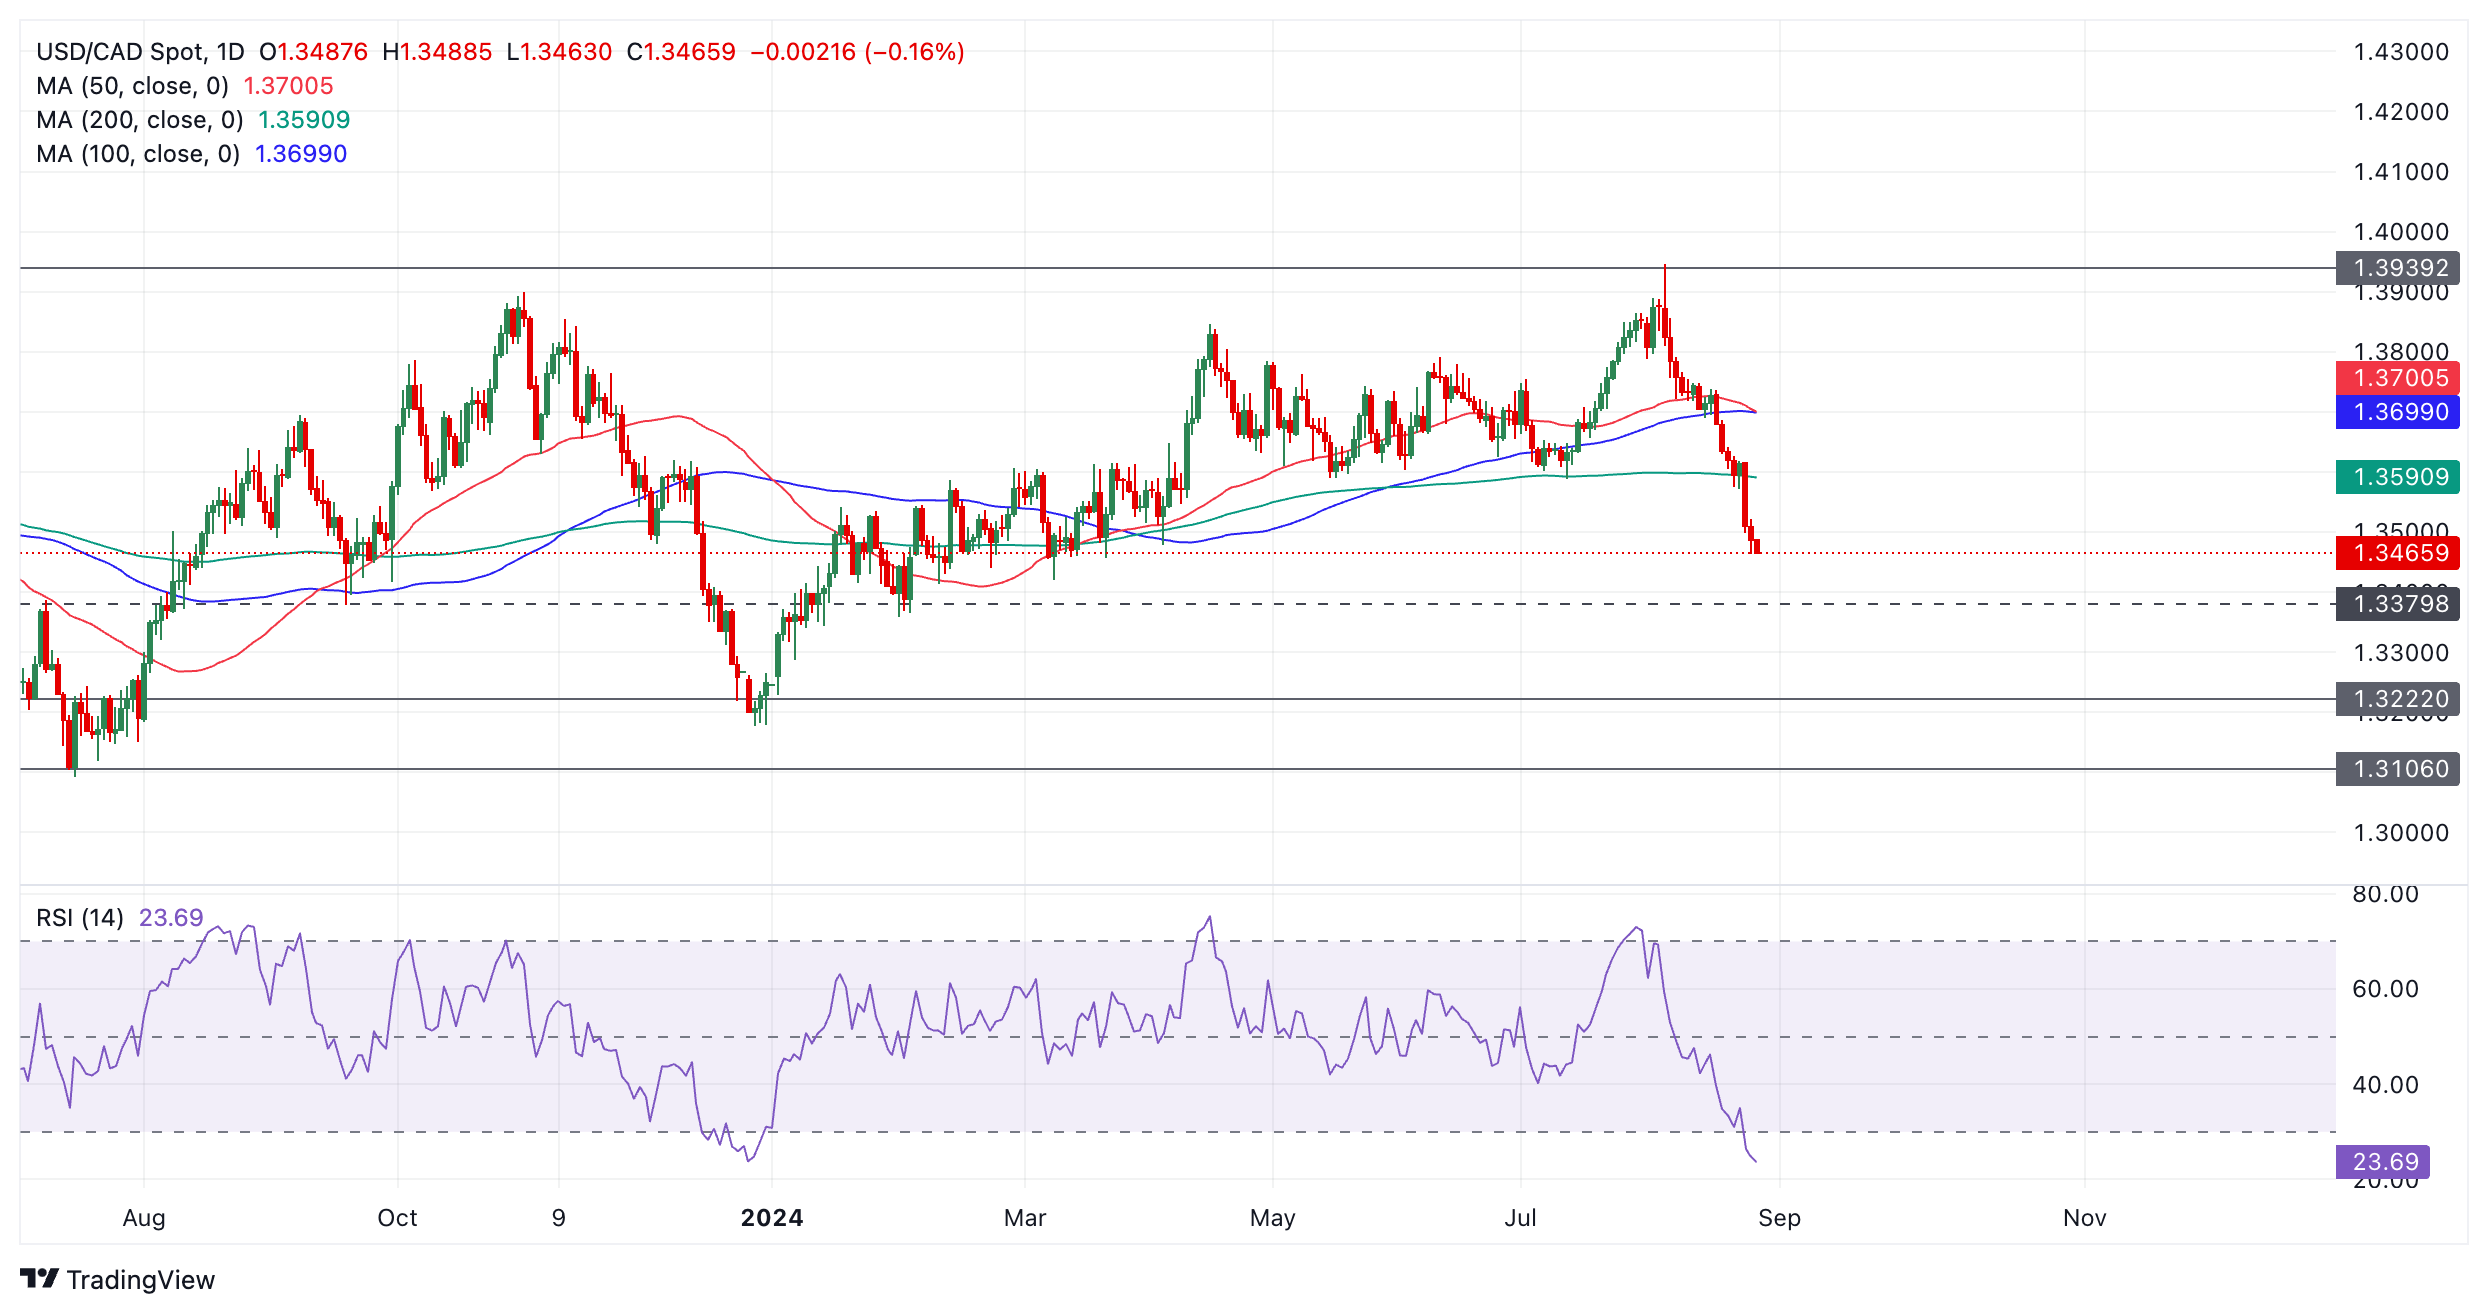
The pair is likely to continue falling in line with the trend, with an eventual target, most probably, at the range floor, starting at 1.3220. 

An interim target is also situated at 1.3380 composed of swing lows in October 2023 and January 2024. 

The Relative Strength Index (RSI) momentum indicator is in the oversold region indicating a risk of a pull back. However, a buy signal is not said to be given until RSI exits oversold and re-enters the neutral territory (on a closing basis) – which has not yet happened. 

Given the oversold state of the RSI, however, traders are advised not to add to their existing short positions. Nor should they close them either, since RSI can remain oversold for a long time during downtrends whilst price continues making lower lows. 

There is no sign from price that it is about to pull back as the chart keeps printing one red bar after another.

Author

Joaquin Monfort

Joaquin Monfort is a financial writer and analyst with over 10 years experience writing about financial markets and alt data. He holds a degree in Anthropology from London University and a Diploma in Technical analysis.

More from Joaquin Monfort
Share:

Editor's Picks

AUD/USD eyes 0.7150 barrier nine-day EMA

AUD/USD inches higher after registering modest losses in the previous day, trading around 0.7130 during the Asian hours. The technical analysis of the daily chart indicates that the pair is moving sideways within the rectangle pattern, suggesting a consolidation as neither the bulls nor the bears have enough momentum to take control of the market.

USD/JPY trades below 160.00 intervention threshold; bullish bias intact

The USD/JPY pair attracts some sellers during the Asian session amid fears that authorities will step in again to prop up the Japanese Yen. Furthermore, the Israel-Lebanon truce prompts some profit-taking around the US Dollar and exerts downward pressure on the currency pair.

Gold defends 200-day SMA, rises toward $4,500

Gold is attempting a tepid recovery toward $4,500 on Thursday, as renewed optimism in the Mideast geopolitical front calms market nerves. This cautious optimism across Asian markets weighs on Oil prices, and diminishes the US Dollar’s safe-haven appeal, helping Gold stage a decent comeback from the weekly low of $4,424.


Hyperliquid: ETF demand, capital rotation fuel HYPE rally as Bitcoin melts

Hyperliquid price sustains an upward trend near its all-time high of $75.76 on Thursday after posting 80% gains in May, while Bitcoin (BTC) retraces below $65,000, triggering a market-wide panic.

Kevin Warsh takes the Fed helm: What it means for the US Dollar
The Federal Reserve moves away from the highly predictable "forward guidance" model of the Jerome Powell era to a new “Kevin Warsh environment”, characterized by less communication, more policy surprises, and an increased focus on the Fed's complex balance sheet.
Recession on paper: What really moves the Canadian Loonie now?

Statistics Canada handed the headline writers a gift and the analysts a headache. Real GDP shrank 0.1% on an annualized basis in the first quarter, and with the fourth quarter of 2025 revised down to a 1.0% contraction, that is two negative quarters in a row, the textbook definition of a technical recession and Canada's first since the pandemic.