USD/CAD Price Forecast: Consolidates around 23.6% Fibo., 200-day SMA holds the key for bulls
- USD/CAD lacks any firm intraday direction and is influenced by a combination of diverging forces.
- A stronger USD lends support, though rebounding Oil prices underpin the Loonie and caps gains.
- A sustained move beyond the 200-day SMA is needed to support prospects for any further upside.

The USD/CAD pair struggles to capitalize on Friday's strong intraday rally of over 100 pips and oscillates in a narrow trading band, above mid-1.3500s through the first half of the European session on Monday.
An uptick in Crude Oil prices is seen underpinning the commodity-linked Loonie and acting as a headwind for the USD/CAD pair. That said, the prospects for another interest rate cut by the Bank of Canada (BoC), bolstered by Friday's disappointing jobs report, cap the upside for the Canadian Dollar (CAD). The US Dollar (USD), on the other hand, benefits from reduced bets for a larger rate cut by the Federal Reserve (Fed) and turns out to be another factor lending some support to the currency pair.
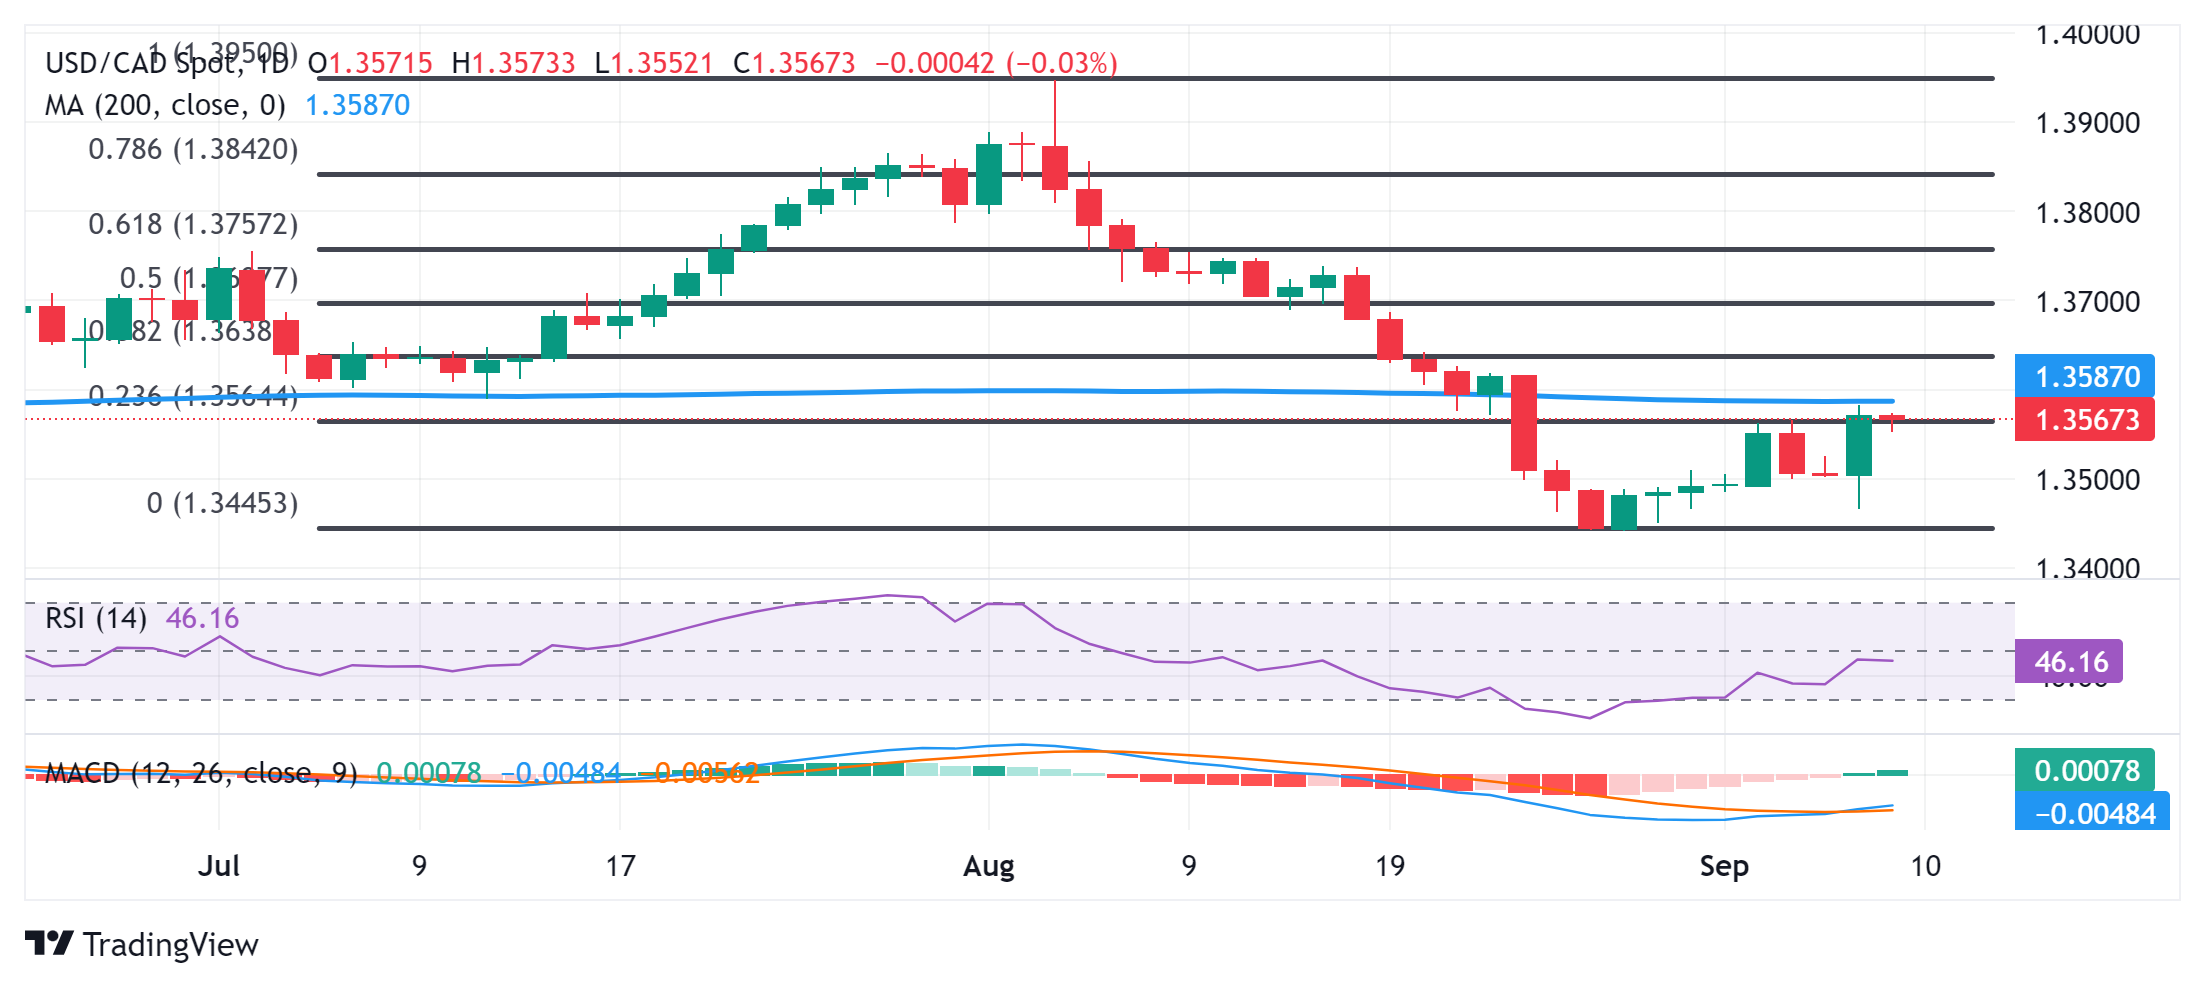
From a technical perspective, spot prices seem to have found acceptance above the 23.6% Fibonacci retracement level of the steep decline witnessed in August. That said, oscillators on the daily chart – though have been recovering from lower levels – are yet to confirm a positive bias. This makes it prudent to wait for a sustained move beyond the very important 200-day Simple Moving Average (SMA), currently pegged near the 1.3600 mark, before placing bullish bets around the USD/CAD pair.
The subsequent move-up has the potential to lift spot prices to the 38.2% Fibo. level, around the 1.3635-1.3640 region. Some follow-through buying should pave the way for additional gains and allow the USD/CAD pair to reclaim the 1.3700 mark. The latter should act as a key pivotal point, which if cleared decisively might shift the near-term bias in favor of bullish traders.
On the flip side, the Asian session low, around the mid-1.3500s, now seems to protect the immediate downside. A convincing break below might expose the 1.3500 psychological mark, below which the USD/CAD pair could accelerate the downfall back towards the 1.3440-1.3435 region, or the lowest level since March touched last month. The downward trajectory could extend further towards the 1.3400 round figure en route to the late January swing low, around the 1.3360-1.3355 region.
USD/CAD daily chart
Fed FAQs
Monetary policy in the US is shaped by the Federal Reserve (Fed). The Fed has two mandates: to achieve price stability and foster full employment. Its primary tool to achieve these goals is by adjusting interest rates. When prices are rising too quickly and inflation is above the Fed’s 2% target, it raises interest rates, increasing borrowing costs throughout the economy. This results in a stronger US Dollar (USD) as it makes the US a more attractive place for international investors to park their money. When inflation falls below 2% or the Unemployment Rate is too high, the Fed may lower interest rates to encourage borrowing, which weighs on the Greenback.
The Federal Reserve (Fed) holds eight policy meetings a year, where the Federal Open Market Committee (FOMC) assesses economic conditions and makes monetary policy decisions. The FOMC is attended by twelve Fed officials – the seven members of the Board of Governors, the president of the Federal Reserve Bank of New York, and four of the remaining eleven regional Reserve Bank presidents, who serve one-year terms on a rotating basis.
In extreme situations, the Federal Reserve may resort to a policy named Quantitative Easing (QE). QE is the process by which the Fed substantially increases the flow of credit in a stuck financial system. It is a non-standard policy measure used during crises or when inflation is extremely low. It was the Fed’s weapon of choice during the Great Financial Crisis in 2008. It involves the Fed printing more Dollars and using them to buy high grade bonds from financial institutions. QE usually weakens the US Dollar.
Quantitative tightening (QT) is the reverse process of QE, whereby the Federal Reserve stops buying bonds from financial institutions and does not reinvest the principal from the bonds it holds maturing, to purchase new bonds. It is usually positive for the value of the US Dollar.
Author

Haresh Menghani
FXStreet
Haresh Menghani is a detail-oriented professional with 10+ years of extensive experience in analysing the global financial markets.


