|

USD/CAD Price Forecast: Bearish Hanging Man reversal pattern confirmed

  • USD/CAD formed a Japanese candlestick reversal pattern on Wednesday. 
  • Price could be about to fall in a large ABC or Measured Move price pattern. 

USD/CAD formed a Hanging Man candlestick reversal pattern (blue rectangle on chart below) on Wednesday which suggests more downside is likely for the pair in the near-term. The pattern gained confirmation after Thursday ended as a long, red, down day. 

USD/CAD Daily Chart 

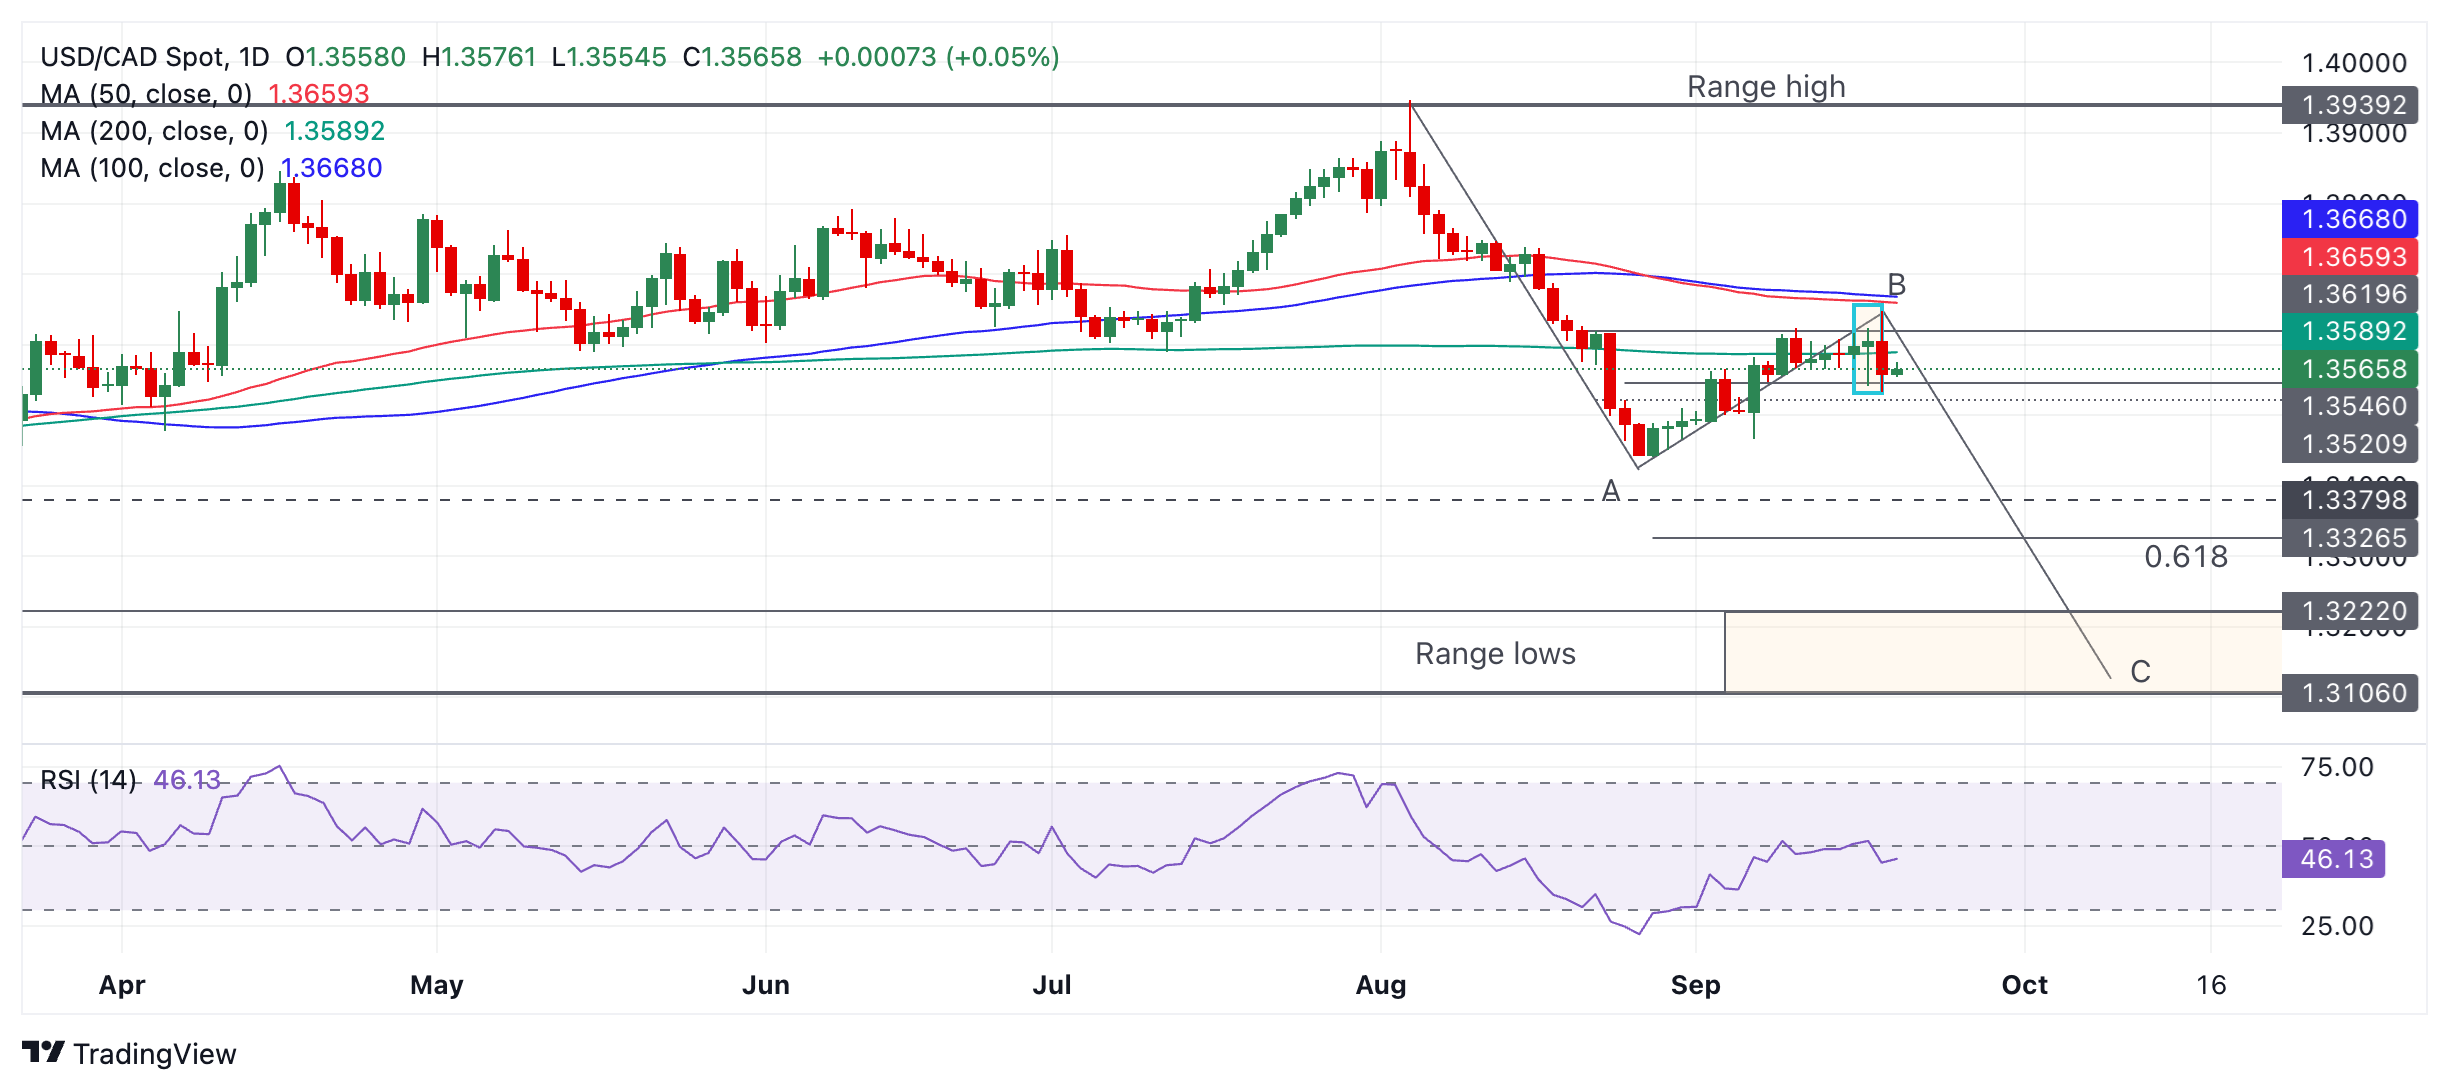
The Hanging Man forms when price rises to a new higher high, pulls back down during the same day, then recovers again and closes the day close to where it opened. If it is followed by a red down day – as was the case with USD/CAD – a short-term bearish reversal is heralded. 

USD/CAD’s move down from the range high looks like it is conforming to an ABC pattern, or “Measured Move” (see labels on chart above). Such patterns are like large zig-zags. The wave C usually reaches a similar length to wave A or at a minimum is a Fibonacci 61.8% of A.

If USD/CAD is really forming an ABC pattern then wave C is probably about to unfold and go substantially lower. Such a down leg would probably fall to the zone of the range lows (orange shaded rectangle on chart above). The 61.8% target, meanwhile, lies at 1.3326. 

It is still a little early to be sure that USD/CAD has reversed and will fall further. A break below 1.3533 (September 19 low) would provide added bearish confirmation, and a break below 1.3466 (September 6) even more solid confirmation.

Author

Joaquin Monfort

Joaquin Monfort is a financial writer and analyst with over 10 years experience writing about financial markets and alt data. He holds a degree in Anthropology from London University and a Diploma in Technical analysis.

More from Joaquin Monfort
Share:

Markets move fast. We move first.

Orange Juice Newsletter brings you expert driven insights - not headlines. Every day on your inbox.

By subscribing you agree to our Terms and conditions.

Editor's Picks

EUR/USD moves sideways below 1.1800 on Christmas Eve

EUR/USD struggles to find direction and trades in a narrow channel below 1.1800 after posting gains for two consecutive days. Bond and stock markets in the US will open at the usual time and close early on Christmas Eve, allowing the trading action to remain subdued. 

GBP/USD keeps range around 1.3500 amid quiet markets

GBP/USD keeps its range trade intact at around 1.3500 on Wednesday. The Pound Sterling holds the upper hand over the US Dollar amid pre-Christmas light trading as traders move to the sidelines heading into the holiday season. 

Gold retreats from record highs, trades below $4,500

Gold retreats after setting a new record-high above $4,520 earlier in the day and trades in a tight range below $4,500 as trading volumes thin out ahead of the Christmas break. The US Dollar selling bias remains unabated on the back of dovish Fed expectations, which continues to act as a tailwind for the bullion amid persistent geopolitical risks.

Bitcoin slips below $87,000 as ETF outflows intensify, whale participation declines

Bitcoin price continues to trade around $86,770 on Wednesday, after failing to break above the $90,000 resistance. US-listed spot ETFs record an outflow of $188.64 million on Tuesday, marking the fourth consecutive day of withdrawals.

Economic outlook 2026-2027 in advanced countries: Solidity test

After a year marked by global economic resilience and ending on a note of optimism, 2026 looks promising and could be a year of solid economic performance. In our baseline scenario, we expect most of the supportive factors at work in 2025 to continue to play a role in 2026.

Avalanche struggles near $12 as Grayscale files updated form for ETF

Avalanche trades close to $12 by press time on Wednesday, extending the nearly 2% drop from the previous day. Grayscale filed an updated form to convert its Avalanche-focused Trust into an ETF with the US Securities and Exchange Commission.