|

USD/CAD Price Analysis: Loonie bulls need validation from 1.3390 and US/Canada employment data

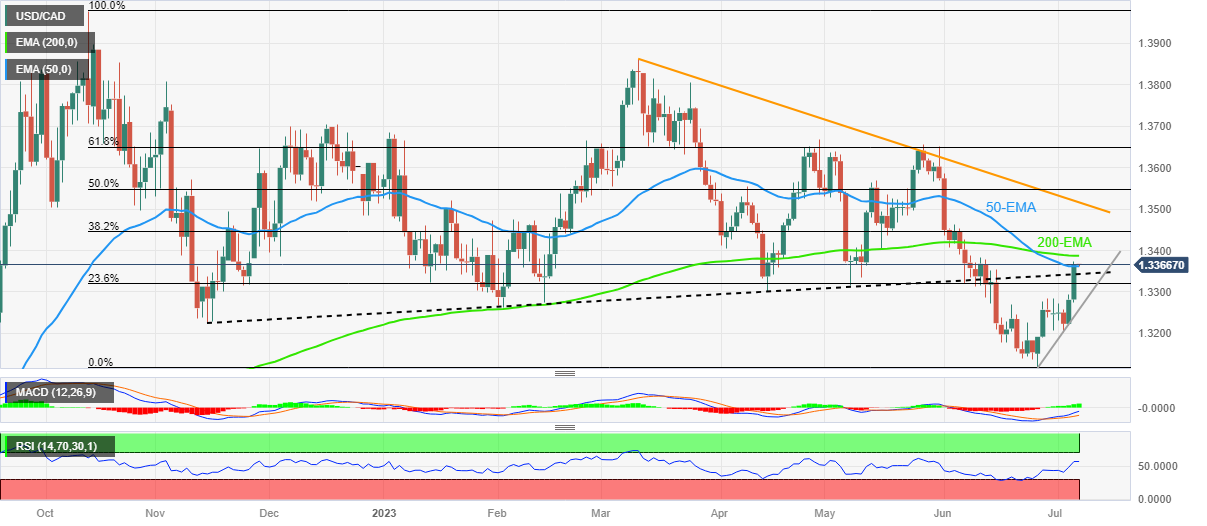
  • USD/CAD grinds near three-week high as key US, Canada data looms, clings to 50-EMA hurdle.
  • Bullish MACD signals, upbeat RSI favors Loonie pair buyers to cross immediate EMA resistance but 200-EMA can prod the bulls.
  • Four-month-old descending resistance line appears the last defense of bears.
  • Previous resistance line from November 2022, short-term rising trend line limits immediate downside.

USD/CAD bulls take a breather around the highest levels in three weeks, after rising the most in 1.5 months the previous day, as it flirts with the 50-Exponential Moving Average (EMA) hurdle amid Friday’s Asian session. That said, the Loonie pair seesaws around 1.3365-70 as markets turn cautious ahead of the top-tier US and Canada employment figures.

Also read: USD/CAD soars to multi-week highs amid hawkish bets on the Fed

It should be noted that the Loonie pair’s upside break of an ascending resistance line stretched from November 2022, now immediate support near 1.3340, joins the bullish MACD signals and upbeat RSI (14) line, not overbought, to keep buyers hopeful of crossing the nearby hurdle of 1.3365.

However, the 200-EMA surrounding 1.3390 appears a major problem for the USD/CAD pair’s further upside.

In a case where the USD/CAD manages to cross the 1.3390 hurdle, also the 1.3400 round figure, it can aim for the 38.2% Fibonacci retracement of its October 2022 to June 2023 downturn, near 1.3445.

Following that, a downward-sloping resistance line from March, near 1.3520 at the latest, will be crucial to watch for clear directions.

On the contrary, a downside break of the resistance-turned-support line, around 1.3340 at the latest, can recall the intraday sellers.

Even so, a one-week-old rising support line near 1.3260 will prod the USD/CAD bears before directing them to the multi-month low marked in the last week around 1.3115.

USD/CAD: Daily chart

Trend: Limited upside expected

Additional important levels

Overview
Today last price1.3365
Today Daily Change0.0084
Today Daily Change %0.63%
Today daily open1.3281
 
Trends
Daily SMA201.3247
Daily SMA501.3402
Daily SMA1001.3491
Daily SMA2001.3507
 
Levels
Previous Daily High1.3293
Previous Daily Low1.322
Previous Weekly High1.3285
Previous Weekly Low1.3117
Previous Monthly High1.3585
Previous Monthly Low1.3117
Daily Fibonacci 38.2%1.3265
Daily Fibonacci 61.8%1.3248
Daily Pivot Point S11.3236
Daily Pivot Point S21.3192
Daily Pivot Point S31.3163
Daily Pivot Point R11.3309
Daily Pivot Point R21.3338
Daily Pivot Point R31.3382

Author

Anil Panchal

Anil Panchal

FXStreet

Anil Panchal has nearly 15 years of experience in tracking financial markets. With a keen interest in macroeconomics, Anil aptly tracks global news/updates and stays well-informed about the global financial moves and their implications.

More from Anil Panchal
Share:

Editor's Picks

EUR/USD flirts with weekly lows near 1.1770

EUR/USD now comes under further selling pressure, breaking below the 1.1800 support to challenge the area of weekly throughs near 1.1770 on Thursday. The pair’s decline comes in response to marked gains in the US Dollar amid steady geopolitical tensions. Ealier in the day, the ECB’s Lagarde delivered cautious remarks, although the currency remained apathetic.

GBP/USD threatens the 200-day SMA near 1.3440

GBP/USD rapidly leaves behind Wednesday’s strong advance, coming under heavy pressure and retesting the 1.3440 zone, where the critical 200-day SMA is located. Cable’s deep pullback follows the strong gains in the Greenback, while investors continue to pencil in a potential BoE rate cut in March.

Gold trims gains, slips back to around $5,170

Gold is now facing some downside pressure, hovering around the $5,170 region on Thursday. The yellow metal surrenders part of its earlier gains on the back of the resurgence of the buying interest in the Greenback. In the meantime, geopolitical tensions in the Middle East continue to limit the downside potential for now.

Stellar: Relief bounce fades as bearish undertone persists

Stellar is trading around $0.16 at the time of writing on Thursday after rebounding more than 8% in the previous day. Derivatives data paints a negative picture as XLM’s short bets hit a monthly high while Open Interest continues to decline.

Changing the game: International implications of recent tariff developments

The Supreme Court ruling on International Emergency Economic Powers Act (IEEPA) tariffs provides limited relief for the rest of the world, with weighted average tariff rates modestly lower.

Bitcoin steadies as traders eye US–Iran talks

Bitcoin (BTC) price is stabilizing around $68,000 at the time of writing on Thursday after a 6.2% relief rally the previous day amid a broader downward trend.