|

USD/CAD Price Analysis: Loonie bears again prods two-month-old hurdle near 1.3650

  • USD/CAD grinds near intraday high, extends previous day’s rebound from one-week low.
  • Downward-sloping resistance line from late March restricts immediate upside of Loonie pair.
  • Looming bull cross on MACD, firmer RSI (14) line favors USD/CAD buyers.
  • Canada Q1 GDP, risk catalysts eyed for clear directions.

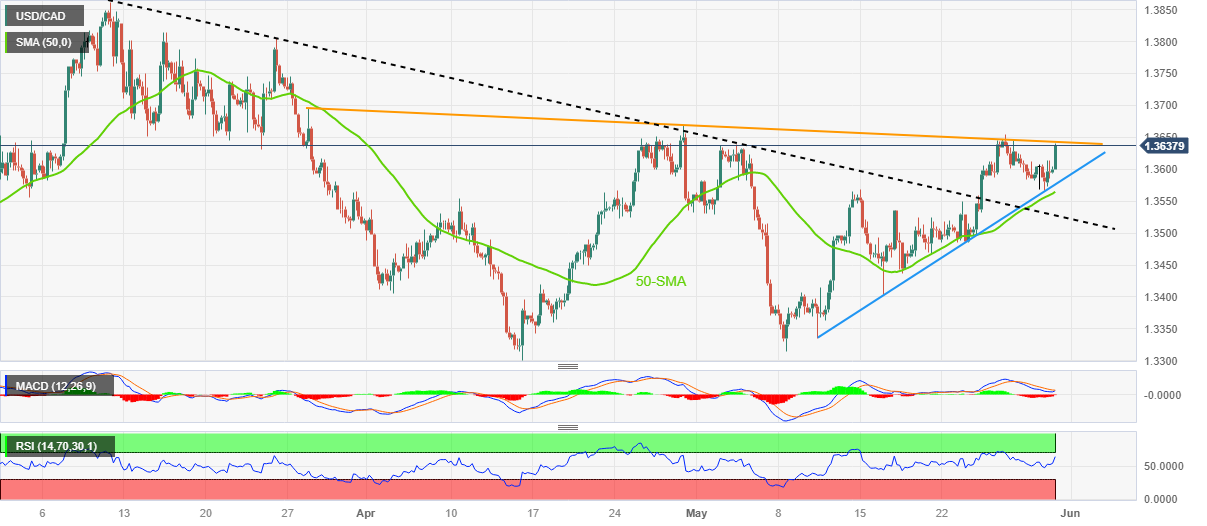
USD/CAD picks up bids to attack a two-month-old descending resistance line around 1.3650 heading into Wednesday’s European session. In doing so, the Loonie pair justifies the market’s cautious mood ahead of the Canadian first quarter (Q1) 2023 Gross Domestic Product (GDP), as well as the key risk catalysts, namely the US debt ceiling deal updates and the Fed bets.

Also read: USD/CAD struggles to cheer Oil price slump near 1.3600 as US Dollar retreats ahead of top-tier catalysts

That said, the Loonie pair currently prods a downward-sloping resistance line from March 28, close to 1.3640 at the latest.

Even so, the recently firmer RSI (14) line, not overbought, joins the looming bull cross on the MACD indicator to keep the USD/CAD buyers hopeful of crossing the immediate 1.3640 resistance line.

Following that, April’s high near 1.3665-70 may act as an extra filter towards the north before directing the USD/CAD toward the late March swing high of around 1.3700 round figure.

On the flip side, a three-week-long ascending trend line and the 50-SMA, respectively near 1.3575 and 1.3565, could challenge the USD/CAD bears.

However, the Loonie pair’s bearish trajectory past 1.3565 needs validation from the previous resistance line from March 10, close to 1.3530.

Overall, USD/CAD is likely to remain firmer and can overcome the immediate upside hurdle.

USD/CAD: Four-hour chart

Trend: Further upside expected

Additional important levels

Overview
Today last price1.3638
Today Daily Change0.0036
Today Daily Change %0.26%
Today daily open1.3602
 
Trends
Daily SMA201.3509
Daily SMA501.3521
Daily SMA1001.3515
Daily SMA2001.3499
 
Levels
Previous Daily High1.3613
Previous Daily Low1.3567
Previous Weekly High1.3655
Previous Weekly Low1.3485
Previous Monthly High1.3668
Previous Monthly Low1.3301
Daily Fibonacci 38.2%1.3596
Daily Fibonacci 61.8%1.3585
Daily Pivot Point S11.3575
Daily Pivot Point S21.3548
Daily Pivot Point S31.3529
Daily Pivot Point R11.3621
Daily Pivot Point R21.364
Daily Pivot Point R31.3667

Author

Anil Panchal

Anil Panchal

FXStreet

Anil Panchal has nearly 15 years of experience in tracking financial markets. With a keen interest in macroeconomics, Anil aptly tracks global news/updates and stays well-informed about the global financial moves and their implications.

More from Anil Panchal
Share:

Editor's Picks

EUR/USD slumps below 1.1750 as USD benefits from risk-aversion

EUR/USD comes under renewed bearish pressure in the European session and trades below 1.1750 following a recovery attempt earlier in the day. The US Dollar gathers strength and weighs on the pair as investors seek refuge in the wake of Israel and the United States' joint attack on Iran.

GBP/USD targets 1.3500 barrier near moving averages

GBP/USD rebounds from the daily losses, trading around 1.3450 during the Asian hours on Monday. The technical analysis of the daily chart indicates an ongoing bearish bias, as the pair trades within a descending channel pattern.

Gold surges on safe-haven demand, tests $5,400

Gold benefits from intense risk-aversion on Monday and climbs to the $5,400 region, setting a fresh monthly-high in the process. Tensions in the Middle East remain high as Israel and Hezbollah continue to exchange strikes following the US-Israel joint attack on Iran over the weekend.

Bitcoin on brink of breakdown amid US-Iran war

Bitcoin (BTC) remains under pressure near the key support level of $65,700. Trading at $66,400 at the time of writing on Monday, a breakdown below this critical level would suggest a deeper correction ahead.

The week ahead: Conflict in the Middle East jolts markets

Events in the Middle East are obviously dominating financial markets this morning. The Brent crude oil price is extending gains and is higher by more than 8%, stock futures are pointing lower and the gold price is higher by more than 2%. 

Pi Network Price Forecast: Core team offloads supply, weighing on PI recovery

Pi Network  hovers below $0.1700, broadly steady at press time on Monday, attempting a recovery after a 2% loss the previous day. Sunday’s decline aligned with nearly 49 million PI tokens offloaded by the Pi Foundation, implying a spike in supply pressure that capped the prevailing four-day recovery.