|

USD/CAD Price Analysis: Further downside towards 1.3580 support confluence appears imminent

  • USD/CAD takes offers to renew intraday low, reverses from “double top”.
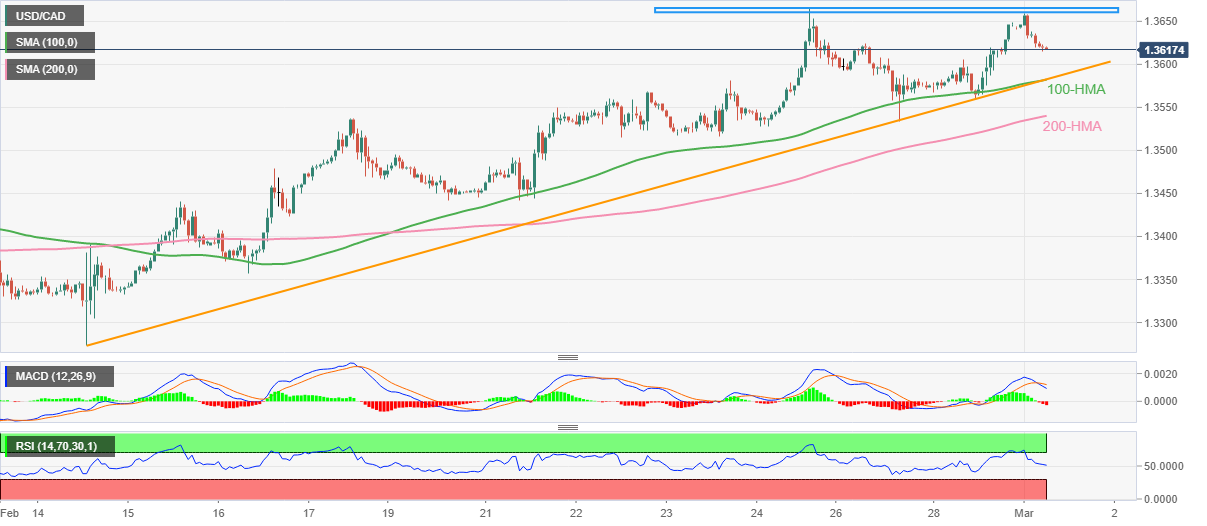
  • 100-HMA, two-week-old ascending trend line restrict immediate downside.
  • RSI’s pullback from overbought territory, bearish MACD signals favor sellers.
  • 200-HMA, 1.3530 act as crucial supports for Loonie pair bears to watch.

USD/CAD welcomes March with a bearish bias as it renews its intraday low near 1.3620 during early Wednesday morning in Europe. That said, the Loonie pair marked the biggest daily gain in a week the previous day, as well as posted the heaviest monthly jump since September 2022 by the end of February.

The quote’s latest pullback could be linked to its inability to cross the late February swing high of 1.3665. In doing so, the pair portrays the double top around 1.3660-65 region.

The chart formation also takes clues from the bearish MACD signals to lure sellers. On the same line could be the RSI (14) pullback from the overbought territory.

Hence, the USD/CAD pair is likely to register further downside. However, a convergence of the 100-Hour Moving Average (HMA) and an upward-sloping support line from mid-February, near 1.3580, appears a tough nut to crack for the bears.

Also adding to the downside filter are the 200-HMA and the weekly low, respectively near 1.3540 and 1.3530.

In a case where the USD/CAD drops below 1.3530 support, the pair confirms the bearish “double top” chart formation, which in turn suggests the theoretical fall towards 1.3400.

Alternatively, a sustained break of the 1.3660-65 hurdle could aim for January’s peak of 1.3685 and the last December’s high near 1.3700 before allowing the USD/CAD bulls a free zone to rule.

USD/CAD: Hourly chart

Trend: Limited downside expected

Additional important levels

Overview
Today last price1.362
Today Daily Change-0.0026
Today Daily Change %-0.19%
Today daily open1.3646
 
Trends
Daily SMA201.3451
Daily SMA501.346
Daily SMA1001.3508
Daily SMA2001.3272
 
Levels
Previous Daily High1.3646
Previous Daily Low1.3561
Previous Weekly High1.3666
Previous Weekly Low1.3441
Previous Monthly High1.3666
Previous Monthly Low1.3262
Daily Fibonacci 38.2%1.3614
Daily Fibonacci 61.8%1.3593
Daily Pivot Point S11.3589
Daily Pivot Point S21.3532
Daily Pivot Point S31.3504
Daily Pivot Point R11.3674
Daily Pivot Point R21.3703
Daily Pivot Point R31.376

Author

Anil Panchal

Anil Panchal

FXStreet

Anil Panchal has nearly 15 years of experience in tracking financial markets. With a keen interest in macroeconomics, Anil aptly tracks global news/updates and stays well-informed about the global financial moves and their implications.

More from Anil Panchal
Share:

Editor's Picks

GBP/USD appears well offered near 1.3160

GBP/USD builds on Tuesday’s losses, although it now manages to pick up some pace and bounce off earlier multi-month troughs near 1.3140. The Greenback’s solid performance and continued political turmoil in the UK are keeping Cable under persistent pressure, with little sign of a meaningful recovery.

EUR/USD softens to near 1.1350 as Fed hike bets rise ahead of PCE inflation data

The EUR/USD pair declines to around 1.1355 during the early Asian trading hours on Thursday. The Euro weakens to its lowest level since June 2025 against the US Dollar as traders increase their bets on US interest rate hikes later this year. The US May Personal Consumption Expenditures inflation data will be the highlight on Thursday. 

Gold struggles near YTD lows on hawkish Fed bets, bullish USD ahead of US PCE

Gold is seen consolidating around $4,000 during the Asian session on Thursday as bears pause following the overnight slump to the lowest level since November 2025. Despite easing inflationary concerns amid falling oil prices, elevated Fed rate-hike bets help the US Dollar preserve its recent strong gains to the highest level since May 2025. This might continue to undermine the non-yielding bullion as the focus shifts to the release of the US PCE Price Index.

Crypto market sheds over 50% of its value amid Bitcoin's brief decline below $60K
The crypto market has erased more than half of its value since reaching an all-time high in late 2025. The decline underscores the severity of the recent bear market and lack of a fresh catalyst to revive investor interest, according to a Wednesday X post by The Kobeissi Letter. The total crypto market cap peaked at a record $4.3 trillion on October 6, 2025.
US-Iran talks: The next 60 days will decide where Oil prices go next
Oil markets received some encouraging news after weeks of rising tensions in the Middle East. But let’s not get ahead of ourselves: we’re far from victory, and markets just seem to have priced out the worst-case scenario. The US and Iran have reportedly made "substantive progress" in talks in Switzerland and agreed on a framework for working toward a broader deal within 60 days.
Regime change: Inside Kevin Warsh's first move to make the Fed unreadable on purpose

The rate did not move. That was the least interesting thing about Kevin Warsh's first meeting in charge of the Fed. The FOMC held its benchmark at 3.50%-3.75% for the fourth straight meeting, exactly as priced, and then the new chair used his first press conference to dismantle the machinery the market has leaned on for a decade.