|

USD/CAD Price Analysis: Consolidates around 1.3650 ahead of Fed’s preferred inflation gauge

  • USD/CAD trades sideways ahead of the US core PCE Inflation that will influence Fed rate cut expectations.
  • The US Dollar remains on backfoot as weak US Q1 GDP raise concerns over the economic outlook.
  • Investors see the BoC pivoting to interest rate cuts from June.

The USD/CAD pair is stuck in a tight range near 1.3650 in Friday’s European session. The Loonie asset struggles for a direction as the US Dollar consolidates ahead of the United States core Personal Consumption Expenditure Price Index (PCE) data for March, which will be published at 12:30 GMT.

On a monthly basis, the underlying inflation data is estimated to have increased steadily by 0.3%. Annually, the inflation measure is seen decelerating to 2.6% from the prior reading of 2.8%. The core PCE Price Index is the Federal Reserve’s (Fed) preferred inflation gauge, which is expected to influence speculation about when the central bank pivots to interest rate cuts, which financial markets are currently anticipating from the September meeting.

The US Dollar Index (DXY) is slightly up at 105.70 in the London session but fell sharply on Thursday after the US Q1 Gross Domestic Product (GDP) report showed that the economy expanded at a slower rate of 1.6% from the consensus of 2.5% and the prior reading of 3.4%. This has triggered doubts over the US economic outlook.

Meanwhile, the Canadian Dollar has remained underpinned against the US Dollar this week despite firm expectations that the Bank of Canada (BoC) will start reducing interest rates from the June meeting. Easing inflation, weak Retail Sales and loosening labor market conditions have boosted BoC rate cut bets for June.

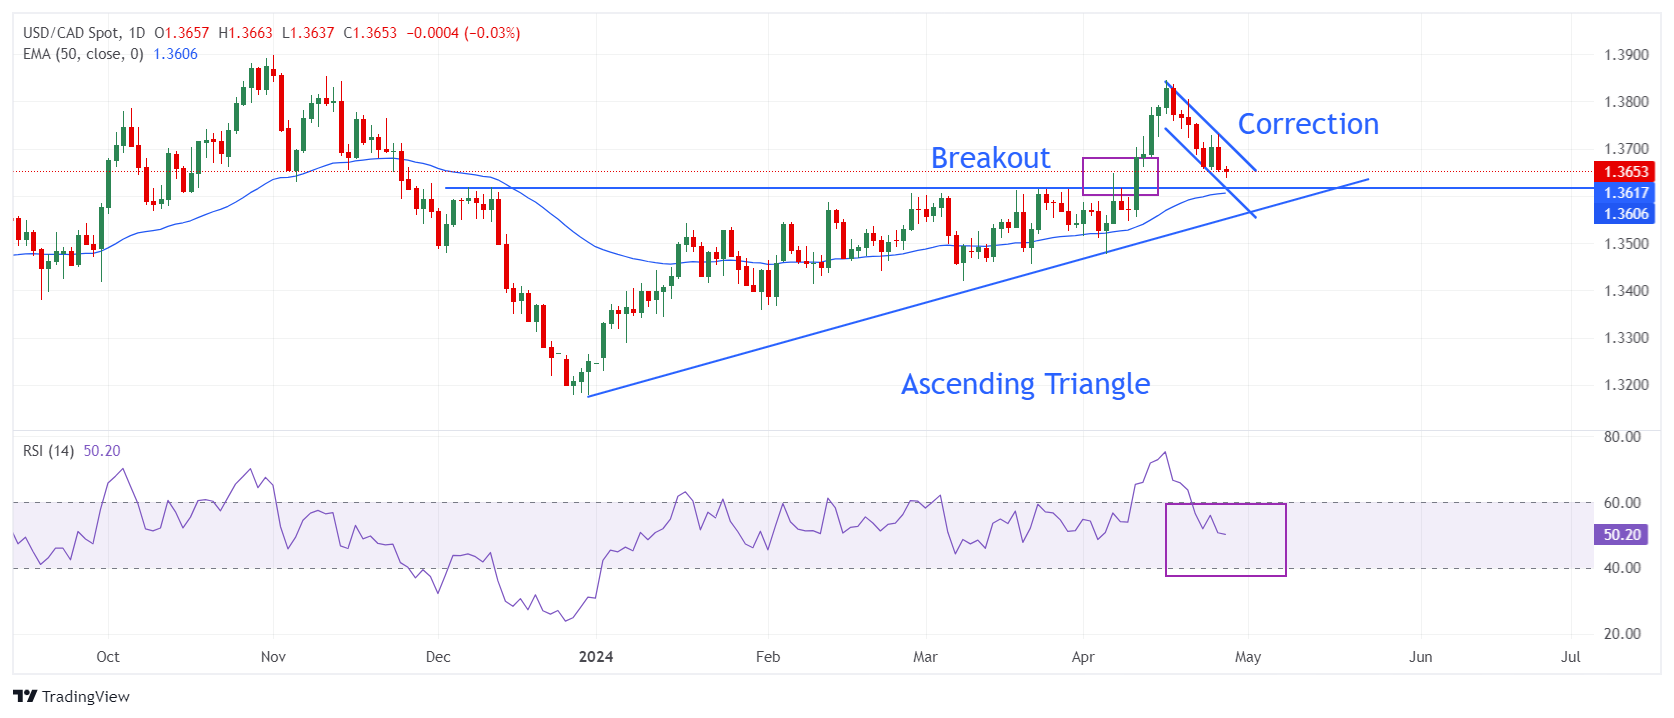
USD/CAD corrects to near the breakout region of the Ascending Triangle chart pattern formed on a daily timeframe. The retest of the breakout region is keenly tracked by investors to build fresh longs as it is considered a discounted price. The 50-day Exponential Moving Average (EMA) near 1.3620 will provide support to the US Dollar bulls.

The 14-period Relative Strength Index (RSI) falls into the 40.00-60.00. The RSI is expected to rebound from 40.00 as the upside bias remains intact. However, a breakdown below the same will increase the odds of a bearish reversal.

Fresh buying opportunity would emerge if the asset falls further to near April 8 high at 1.3617. This would drive the asset towards April 11 low at 1.3661, followed by the round-level resistance of 1.3700.

In an alternate scenario, a breakdown below April 9 low around 1.3547 will expose the asset to the psychological support of 1.3500 and March 21 low around 1.3456.

USD/CAD daily chart
USD/CAD

Overview
Today last price1.3658
Today Daily Change0.0001
Today Daily Change %0.01
Today daily open1.3657
 
Trends
Daily SMA201.3663
Daily SMA501.3583
Daily SMA1001.3499
Daily SMA2001.3539
 
Levels
Previous Daily High1.3731
Previous Daily Low1.365
Previous Weekly High1.3846
Previous Weekly Low1.3724
Previous Monthly High1.3614
Previous Monthly Low1.342
Daily Fibonacci 38.2%1.3681
Daily Fibonacci 61.8%1.37
Daily Pivot Point S11.3628
Daily Pivot Point S21.3599
Daily Pivot Point S31.3547
Daily Pivot Point R11.3709
Daily Pivot Point R21.3761
Daily Pivot Point R31.379

Author

Sagar Dua

Sagar Dua

FXStreet

Sagar Dua is associated with the financial markets from his college days. Along with pursuing post-graduation in Commerce in 2014, he started his markets training with chart analysis.


More from Sagar Dua
Share:

Editor's Picks

GBP/USD keeps the bid bias near 1.3550

GBP/USD leaves behind part of the recent three-day retracement and hovers around the 1.3550 region on Monday. The Greenback’s fresh downward trend helps Cable and the rest of the risk complex recoup part of the recent ground lost while attention remains on the potential Fed rate path.

EUR/USD retakes 1.1600; looks at the 200-day SMA

EUR/USD manages to gather fresh steam and advances past the 1.1600 hurdle as Monday’s NA session draws to a close. Indeed, the pair patially reverses Friday’s sharp retracement amid the renewed downside momentum in the US Dollar. Moving forward, the flash Inflation Rate in the euro zone and US JOLTs and the ISM Manufacturing should keep investors entertained on turnaround Tuesday.

Gold: Is the bullish run over?

Gold adds to Friday’s marked decline, although it has managed to bounce off earlier lows in the sub-$4,400 region per troy ounce on Monday. The yellow metal’s pullback comes despite the softer stance in the US Dollar and steady uncertainty in the Middle East, although rising yields keep bulls at bay for now.

Bitcoin and Gold Outlook: BTC clings to support, XAU slides as US-Iran tensions re-escalate
Bitcoin (BTC) maintains stability above $78,000 support on Monday as crypto prices broadly consolidate. Gold (XAU/USD), meanwhile, holds above $4,400, marking two consecutive days of declines. Sentiment in the broader cryptocurrency market remains broadly positive, with the Fear & Greed Index holding at 62 on Monday, down slightly from 69 the previous day.
Oil rallies on fresh persian gulf strikes
Energy prices are trading firmer this morning after the US carried out targeted strikes against Iran, drawing retaliatory strikes and reinforcing concerns about a prolonged stalemate in the Persian Gulf. Oil prices started the week stronger following the first military strikes between the US and Iran in a month. ICE Brent briefly moved back above US$90/bbl in early morning Asia trading.
Diesel’s record $100 warning: The oil shock hiding in plain sight

The Oil market may look calmer than it did a few months ago, but diesel is sending a very different message. The US diesel crack spread, the premium of ultra-low sulphur diesel futures over WTI, recently surged above $100 per barrel for the first time, reaching an intraday record of just over $102.00.