USD/CAD Price Analysis: Consolidates around 1.3580 ahead of US job data
- USD/CAD trades lacklustre around 1.3580 as the focus shifts to US JOLTS Job Openings data.
- Traders pare Fed rate cut bets for June on strong US Manufacturing PMI.
- USD/CAD is on the verge of breaking out of the ascending triangle pattern.

The USD/CAD pair trades sideways around 1.3580 in Tuesday’s European session. The Loonie asset struggles to extend recovery above 1.3580 as investors look for fresh United States labor data to get cues about when the Federal Reserve (Fed) will start reducing interest rates.
This week, investors will focus on the US Nonfarm Payrolls (NFP) report for March, which will be published on Friday. In today’s session, investors will focus on the JOLTS Job Openings for February. US employers are anticipated to have posted fresh 8.74 million job openings, lower than 8.863 million in January.
Meanwhile, the market sentiment is risk-off as strong United States Manufacturing PMI for March forced traders to unwind their bets for the Fed to begin the rate-cut cycle from June. The US Institute of Supply Management (ISM) reported the Manufacturing PMI above the 50.0 threshold at 50.3 after shrinking for 16 months in a row.
S&P 500 futures have posted some losses in the European session. The US Dollar Index (DXY) trades close to four-month high slightly above 105.00.
The next move in the Canadian Dollar will be guided by the labor market data for March, which will be published on Friday. Canadian employers are expected to have recruited 25K job seekers.
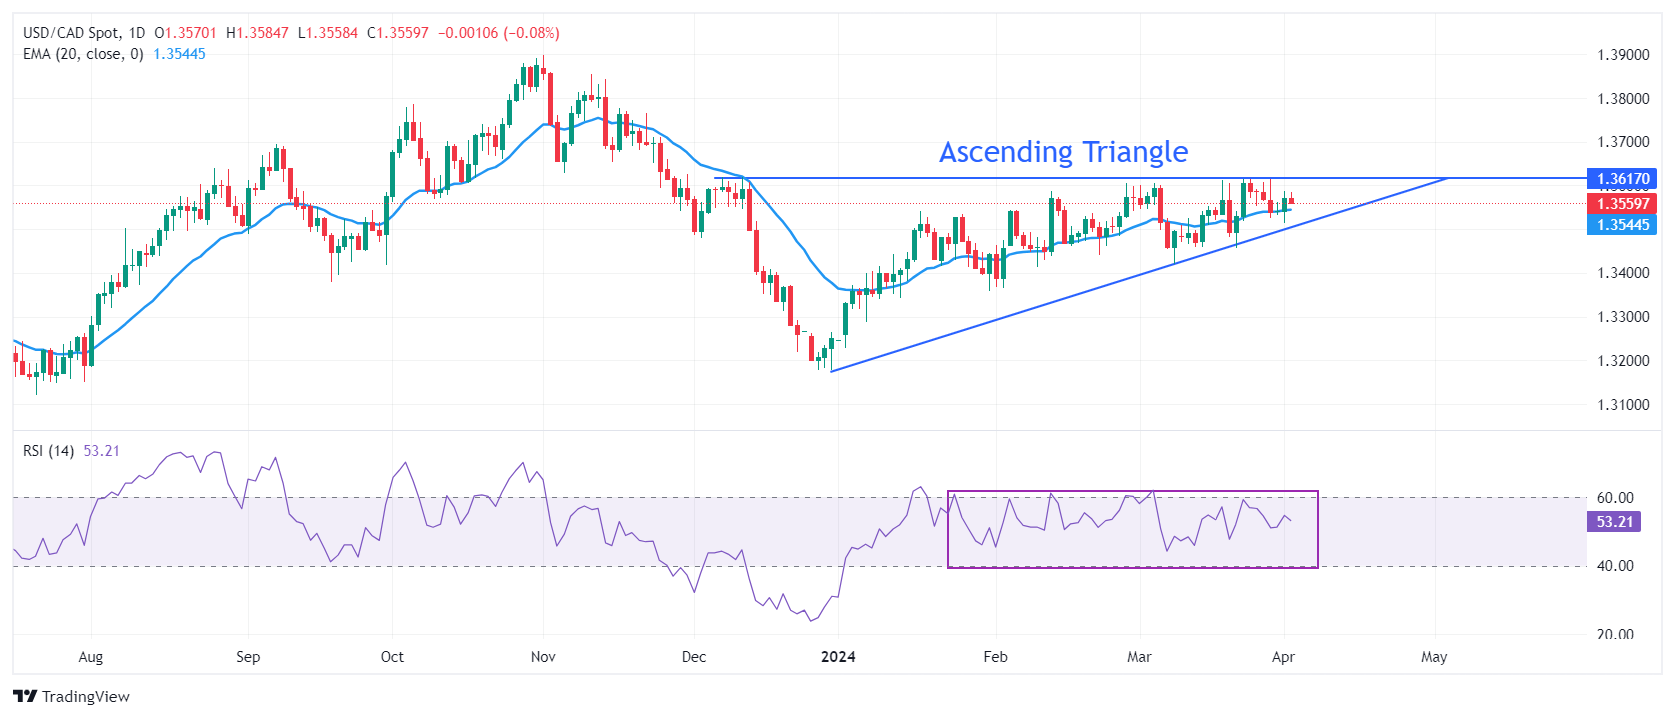
USD/CAD is inch from breaking out of the Ascending Triangle pattern formed on a daily time. A breakout of a Triangle pattern could happen in either direction. The chart pattern exhibits a sharp volatility contraction. The upward-sloping border of the aforementioned pattern is placed from December 27 low at 1.3177 while horizontal resistance is plotted from December 7 high at 1.3620
The 20-day Exponential Moving Average (EMA) near 1.3520 remains sticky to spot prices, indicating a sideways trend.
The 14-period Relative Strength Index (RSI) oscillates inside the 40.00-60.00 range, indicating indecisiveness among market participants.
The Loonie asset would observe a fresh upside if it breaks above December 7 high at 1.3620. This will drive the asset towards May 26 high at 1.3655, followed by the round-level resistance of 1.3700.
On the flip side, a downside move below February 22 low at 1.3441 would expose the asset to February 9 low at 1.3413. A breakdown below the latter would extend downside towards January 15 low at 1.3382.
USD/CAD daily chart
Author

Sagar Dua
FXStreet
Sagar Dua is associated with the financial markets from his college days. Along with pursuing post-graduation in Commerce in 2014, he started his markets training with chart analysis.


