USD/CAD Price Analysis: Bulls seeking an upside extension from hourly support
- USD/CAD bulls are committing which could lead to upside correction in the coming hours.
- The daily chart and hourly time frame mary for a continuation towards the 61.8% ratio.

USD/CAD has been making tracks to the upside in recent sessions and is now on the verge of a bullish extension. The hourly support is currently holding up so bulls are looking for an optimal entry at this juncture. However, there is the possibility of another test of the bullish commitments near 1.27 the figure.
USD/CAD daily chart
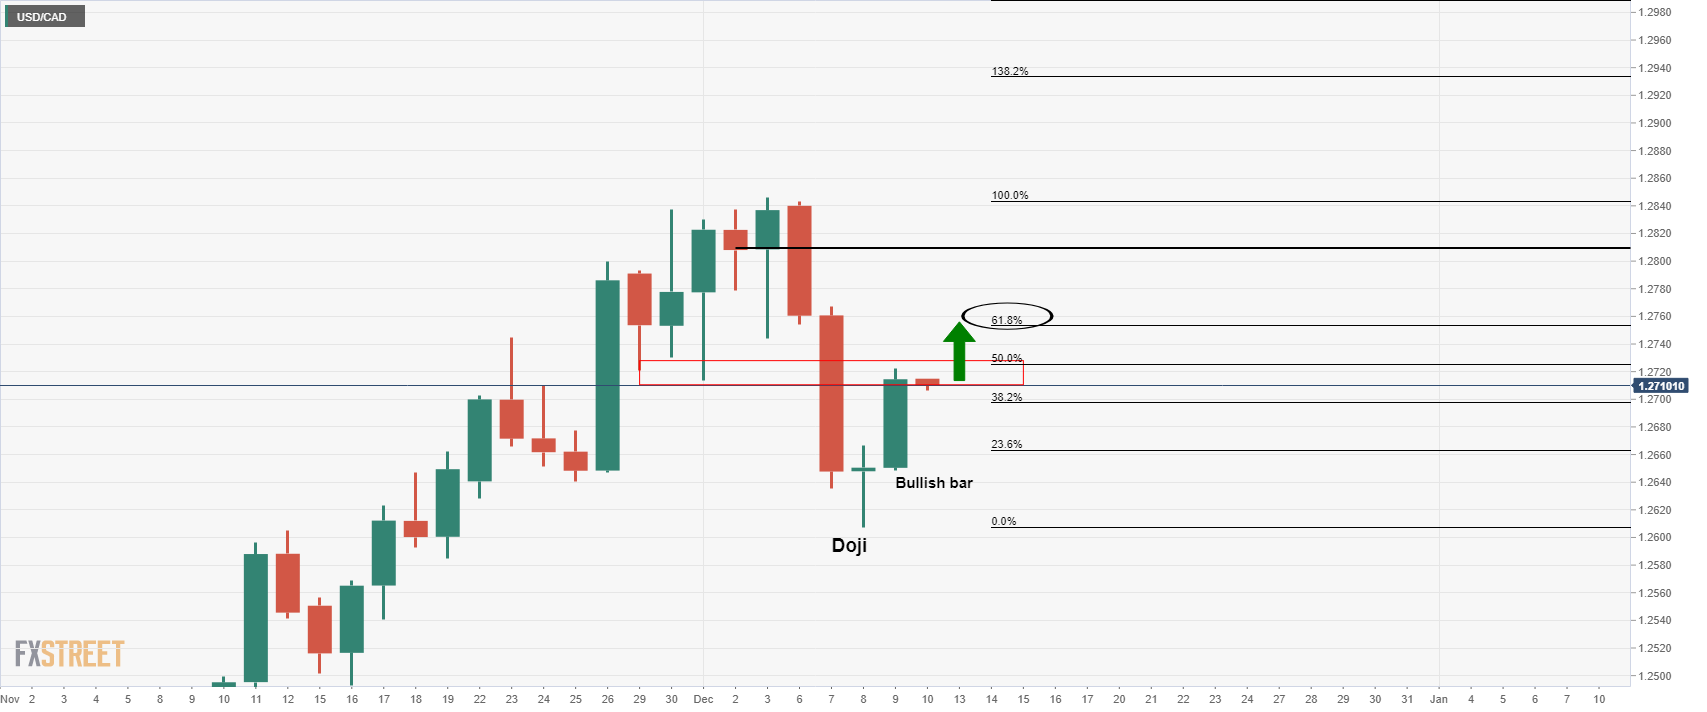
The daily chart shows that the price stalled on the downside with a dojo reversal candle followed by a strongly bullish candle and close the next day. This is a bullish prospect and the price would be expected to move through a 50% mean reversion to target the 61.8% ratio or even as high as the neckline of the M-formation. That comes in near to 1.28 the figure.
USD/CAD hourly chart
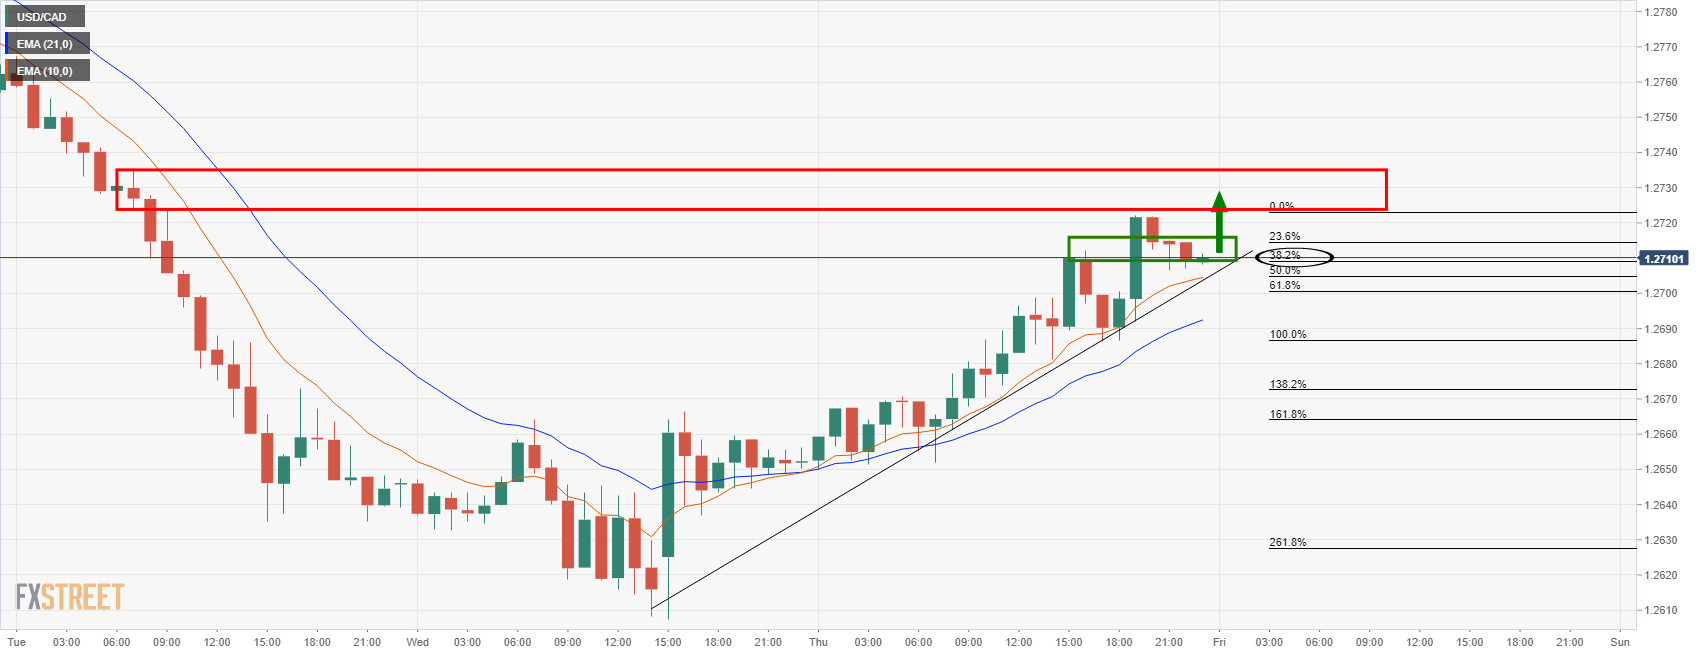
From an hourly perspective, the price is testing hourly support which includes the dynamic trendline, the 10-EMA and the prior resistance of the last bullish impulse. However, while the price has already reached a 38.2% Fibonacci level, there is still potential for a deeper correction to the 61.8% that meets structure also, as follows:
USD/CAD M15 chart
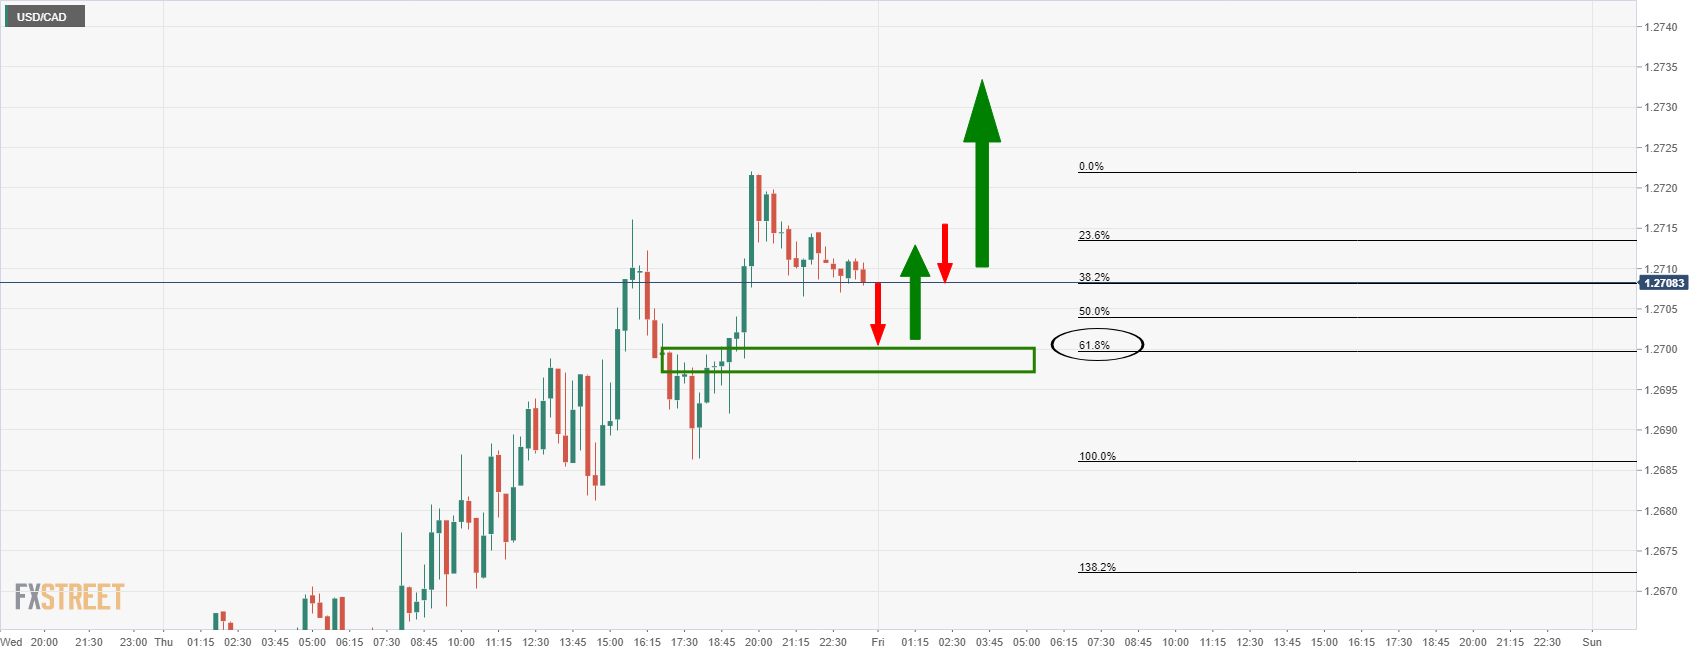
Should the hourly support give out, then the next layer to the downside comes in just below 1.27 the figure and it will be critical that the bulls commit there.
Author

Ross J Burland
FXStreet
Ross J Burland, born in England, UK, is a sportsman at heart. He played Rugby and Judo for his county, Kent and the South East of England Rugby team.


