USD/CAD Price Analysis: Bulls cheer 21-day EMA break near nine-day high
- USD/CAD extends gains after multiple days of trading below 21-day EMA.
- 50-day EMA, 50% Fibonacci retracement on the bulls' radar.
- 1.3030 can return to the chart during the pullback.

USD/CAD takes the bids near 1.3085, the highest in two weeks, during the pre-European session on Wednesday. In doing so, the pair holds on to gains after successfully breaking the 21-day EMA on a daily closing basis the previous day.
The buyers are now aiming the 50-day EMA level of 1.3116 as the immediate resistance ahead of 50% Fibonacci retracement of the pair’s declines from September 2019 to January 01 low, near 1.3145.
In a case where the bulls remain dominant post-1.3145, the 1.3180/85 zone has multiple upside barriers, ahead of the 61.8% of Fibonacci retracement near 1.3200.
On the flip side, sellers will look for entry below the 21-day EMA level of 1.3070 while targeting the 1.3030 support level.
During the quote’s further downside below 1.3030, 1.3000 and 1.2960 can entertain the bears.
USD/CAD daily chart
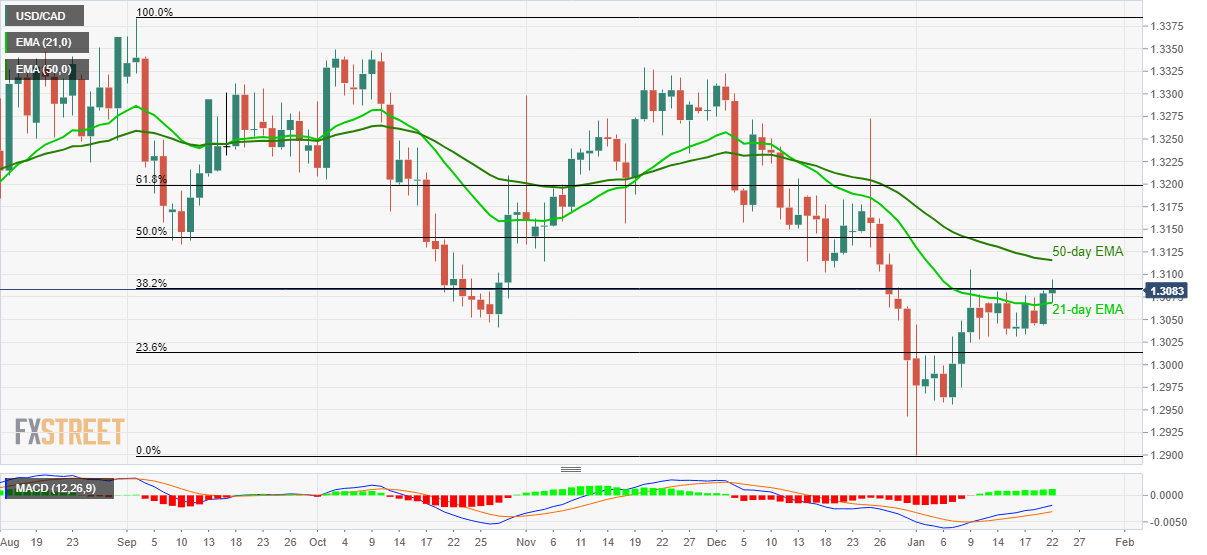
Trend: Bullish
Author

Anil Panchal
FXStreet
Anil Panchal has nearly 15 years of experience in tracking financial markets. With a keen interest in macroeconomics, Anil aptly tracks global news/updates and stays well-informed about the global financial moves and their implications.


