US equities mix on Friday, S&P 500 threatens a pullback
- S&P 500, NASDAQ Composite end six-day record streaks.
- Despite weaker Friday, US indexes closed in the green for a third straight week.
- US Fed on the docket for next week.

US equities closed mixed on Friday to cap off a week of stunning record closes. Over-eager markets that have been leaning into rate cut bets in recent weeks second-guessed US economic conditions after US Personal Consumption Expenditure (PCE) Price Index figures showed cooling inflation, but consumer spending and housing activity hinted at a US economy that is too robust to allow for a rapid approach on Federal Reserve (Fed) rate cuts.
Money markets repriced odds of a first rate trim from the Fed to the Federal Open Market Committee’s (FOMC) meeting in May, with bets of a March rate cut down to 47% according to the CME’s FedWatch Tool.
US Core YoY PCE Price Index figures for December printed at 2.9% on Friday, below the forecast 3.0% and slipping back from the previous period’s 3.2%. Markets initially rose on reaction to the good news that cooling inflation might lead to faster, sooner rate cuts from the Fed, but an uptick in Personal Spending and Pending Home Sales put a damper on rate hopes.
US Personal Spending rose 0.7% in December compared to the 0.4% forecast and 0.4% previous (revised from 0.2%), and Pending Home Sales jumped 8.3% in December compared to the forecast 1.5% and -0.3% previous (revised from 0.0%).
Revenue forecasts on Wall Street missed expectations for major tech stocks including Intel and chipmaker tool manufacturer KLA Corp, causing equities to rethink recent bullish momentum on tech hopes alongside recent declines in tech darlings Tesla and Apple.
The Dow Jones Industrial Average (DJIA) gained 60 points to close up 0.16% at $38,109.43 while the Standard & Poor’s 500 (S&P) Major equity index closed down 0.07%, shedding a little over 3 points and ending Friday at $4,890.97.
The NASDAQ Composite declined on tech stock hesitancy, losing 55 points and closing down by a third of a percent at $15,455.36.
S&P Technical Outlook
The S&P closed in the green for a third straight week, chalking in 12 winning weeks out of the last 13, and the major index is up nearly 20% from the last significant swing low into $4,102.02 in October.
The S&P 500 is trading well above the 200-day Simple Moving Average (SMA) near $4,425.00, and is in play near the $4,900.00 as investors eye another push towards the $5,000.00 major handle nearby.
S&P 500 Hourly Chart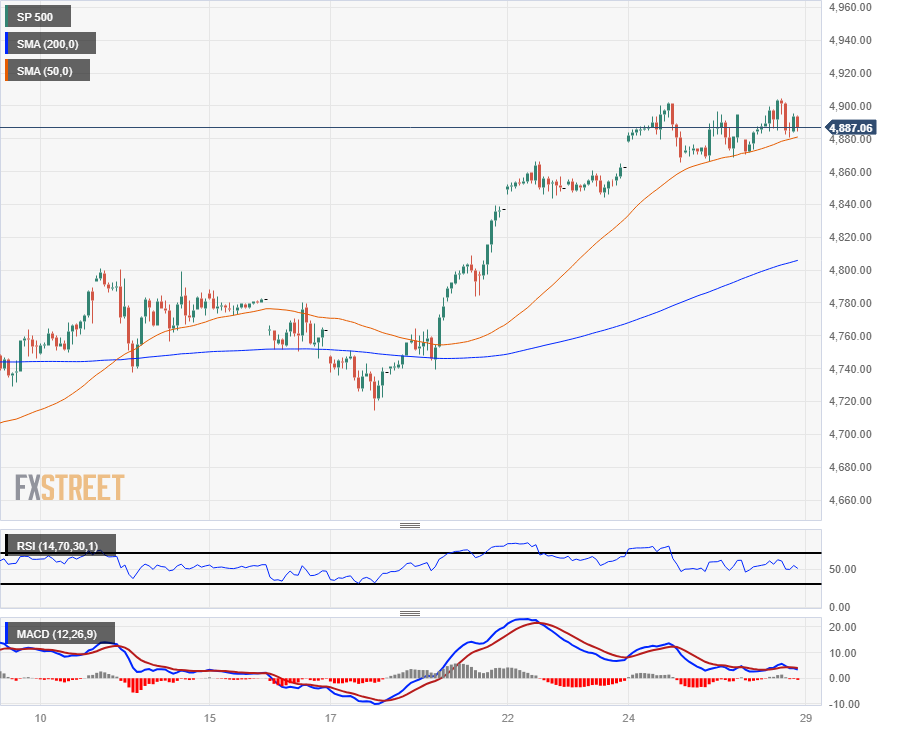
S&P 500 Daily Chart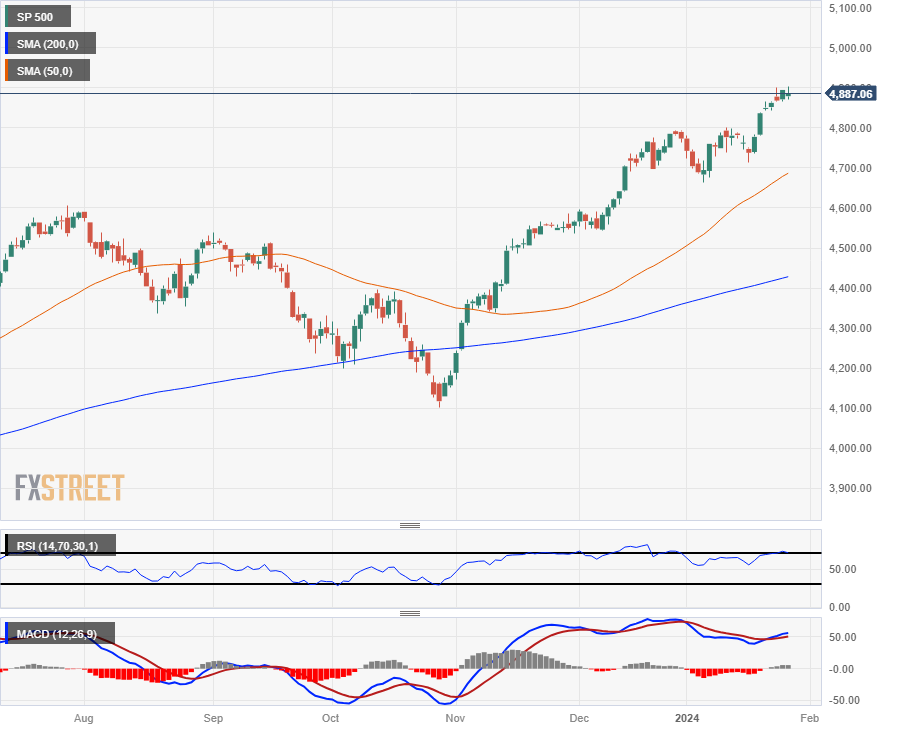
Author

Joshua Gibson
FXStreet
Joshua joins the FXStreet team as an Economics and Finance double major from Vancouver Island University with twelve years' experience as an independent trader focusing on technical analysis.


