|
US Dollar Index technical analysis: DXY off daily lows, trading near 97.70 level
- The US Dollar Index (DXY) is trading down on Tuesday after failing to breach the 97.90 resistance.
- Support is seen at the 97.60 and 97.45 price levels.
- The main macroeconomic event of the week is likely going to be the Fed Interest Rate Decision on Wednesday.

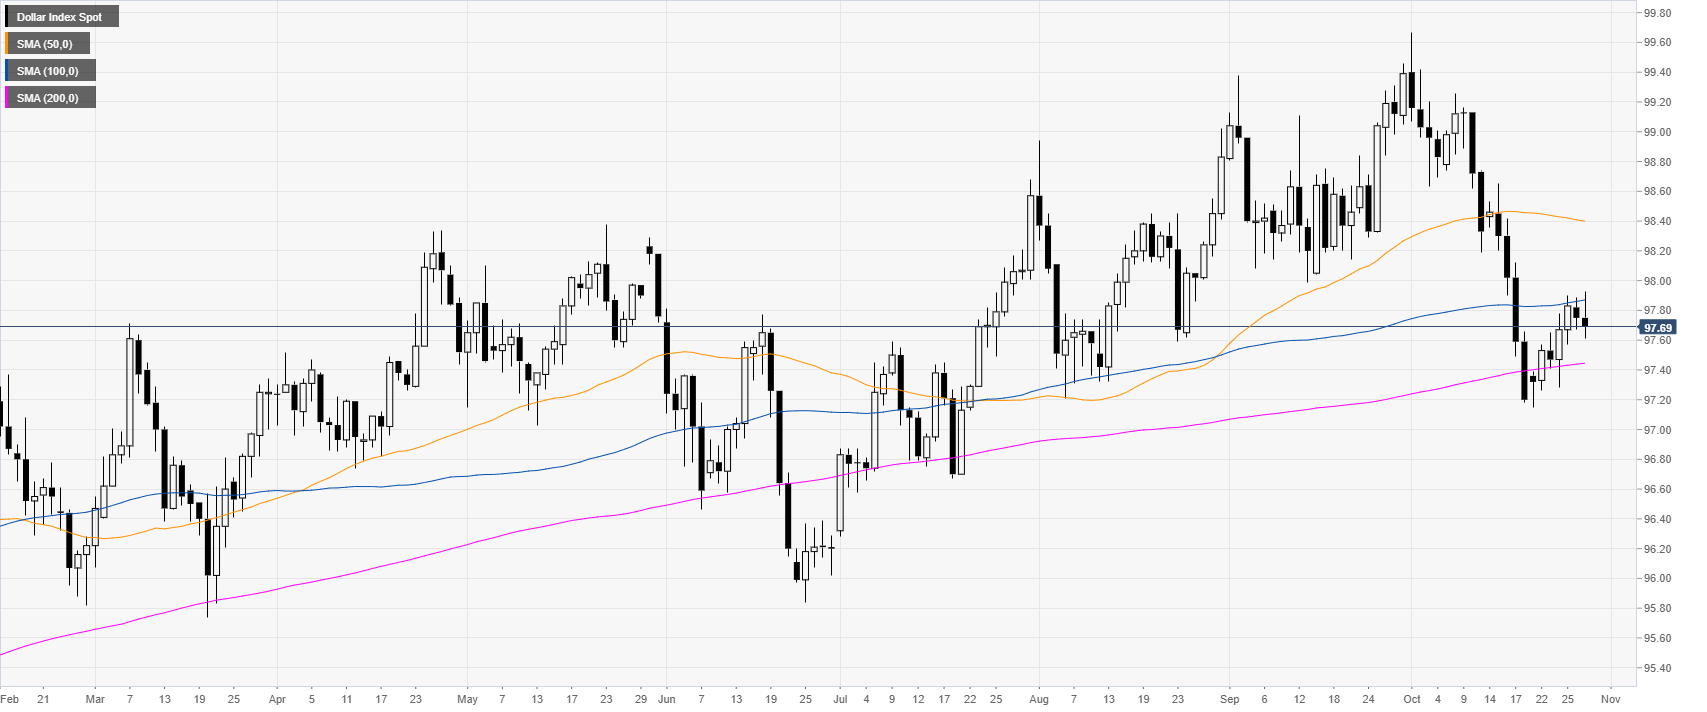
DXY daily chart
The US Dollar Index (DXY) is trading above its 200-day simple moving average (DMA) after experiencing a sharp drop in October. This Tuesday, the buck is trading on the back foot finding resistance at the 97.90 resistance. The main macroeconomic event of the week is likely going to be the Fed Interest Rate Decision on Wednesday.
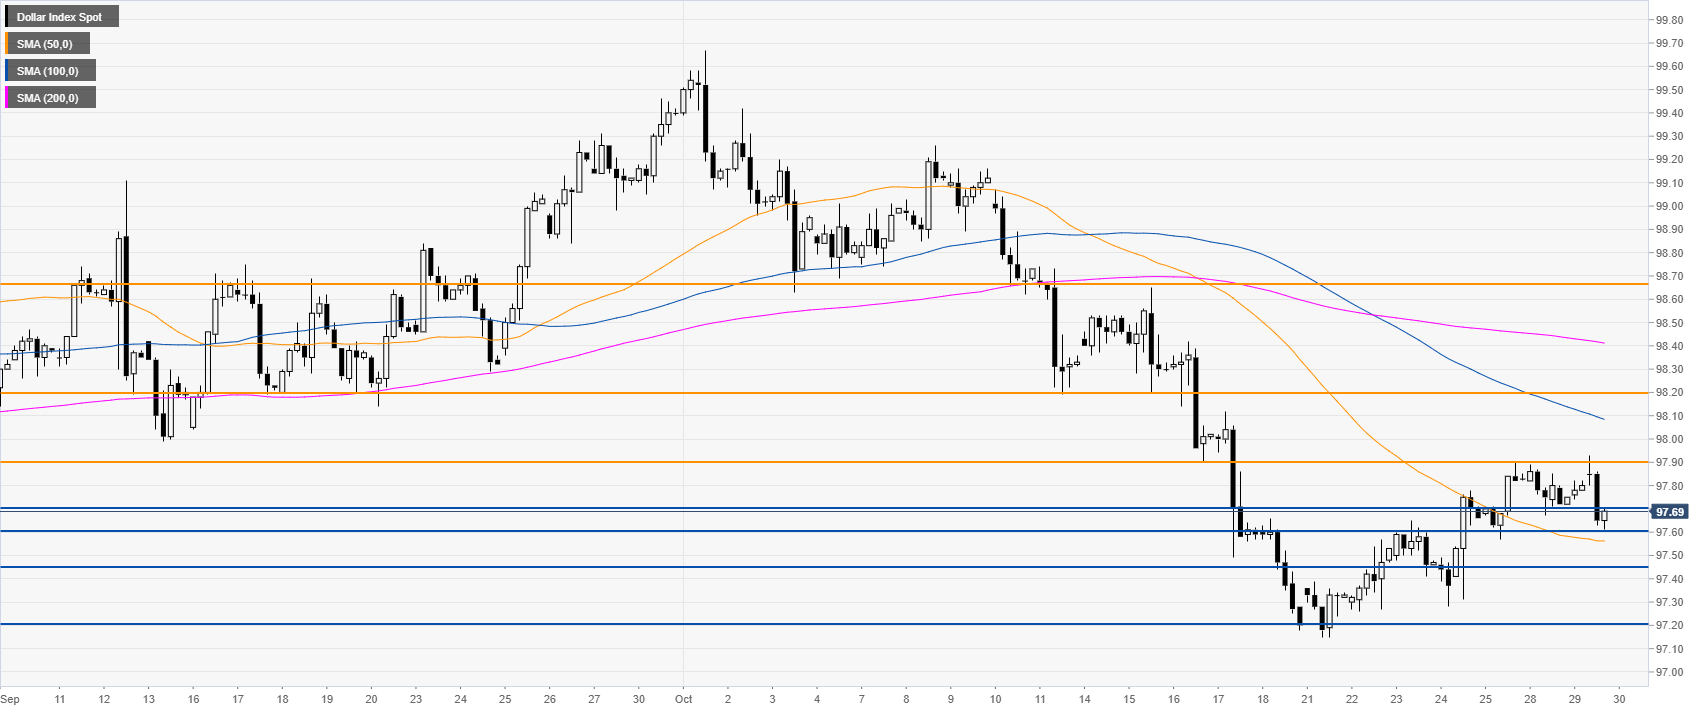
DXY four-hour chart
On the four-hour chart, DXY is trading above the 50 SMA but below the 100 and 200 SMAs. In order to confirm the recovery, the Greenback would need to surpass 97.90 on a daily basis. Targets to the upside can be seen near the 98.20 and 98.66 price levels.
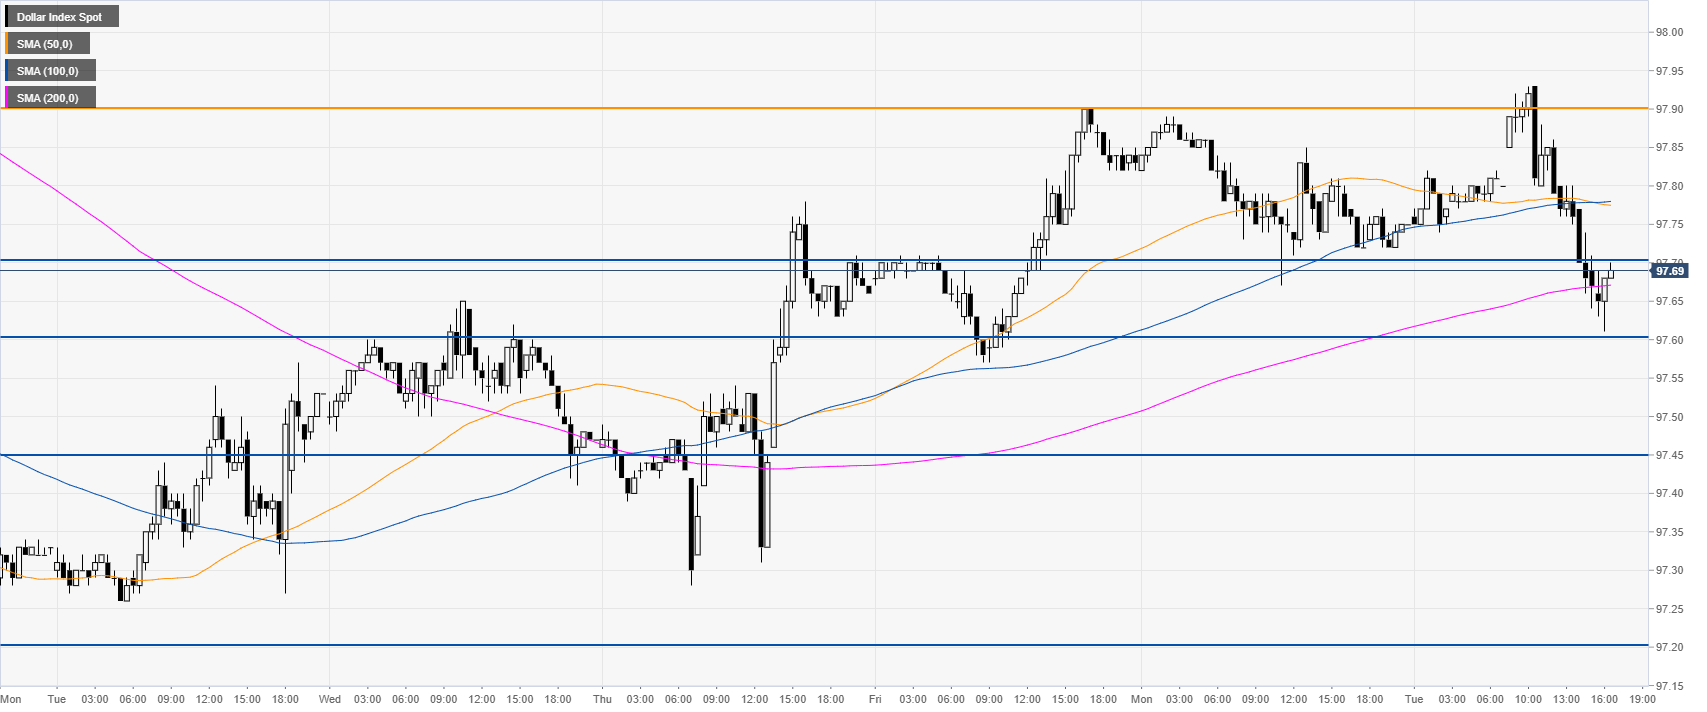
DXY 30-minute chart
DXY is challenging the 200 SMA. Buyers need to defend the 97.60 support if they want to keep the bullish bias in the short term intact. Support is seen in the 97.70/60 zone and further down at the 97.45 level.
Additional key levels
Author

Flavio Tosti
Independent Analyst
More from Flavio Tosti


