|

US Dollar Index Price Forecast: Finds floor at long-term historical support level

  • The US Dollar Index has touched down on a key support level at the 100 mark.
  • This has historically provided a springboard for a recovery, however, it is too early to say whether history will repeat itself. 

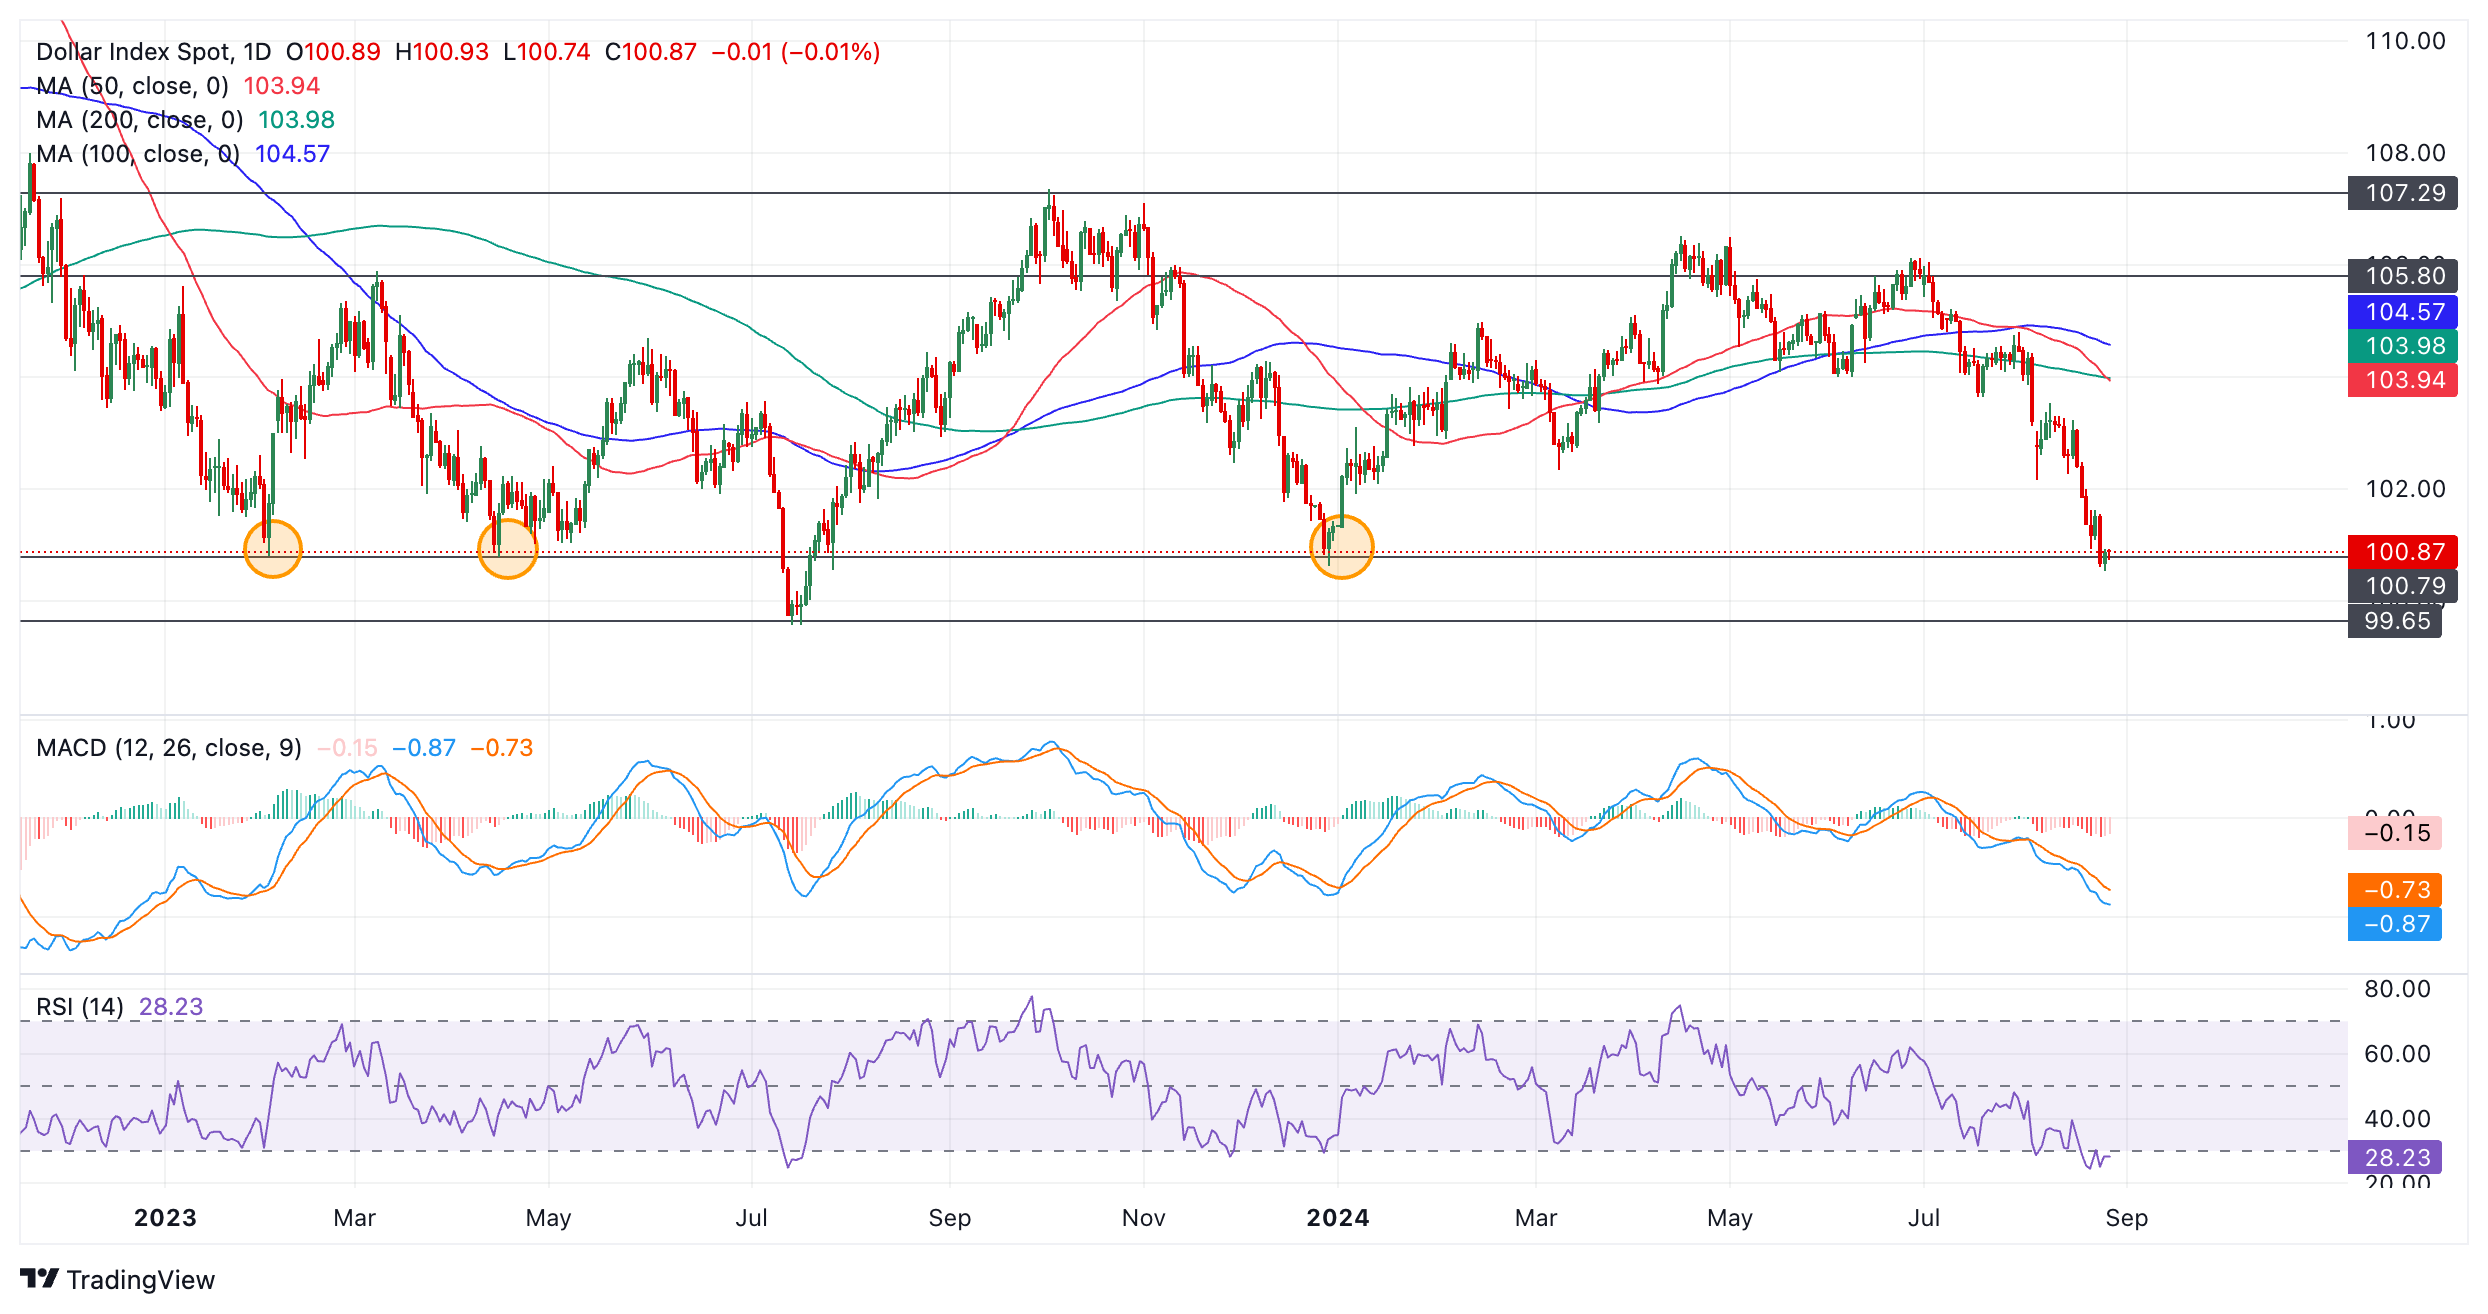
The US Dollar Index (DXY) is in a medium and long-term sideways trend within a multi-year range. Since late July it has been steadily unfolding a down leg within that range from the ceiling at around 105, to the range floor at the 100 level. 

100 is important. Apart from being a key psychological level, 100 is also a major historical support level which has provided a safety net to falling prices on three prior occasions since 2023 (circled below). The question is, will 100 come to the rescue again on this occasion? 
US Dollar Index Daily Chart 

Price action is still bearish and there are no strong bullish reversal patterns forming – neither of the shape or the candlestick variety. This suggests a risk of more downside. A continuation south would probably see DXY reach the next support level at the 99.57, the July 2023 low. This is the lowest floor of the range – a decisive break below there would be a very bearish sign. 

The Relative Strength Index (RSI) momentum indicator is oversold on both the daily chart and weekly chart (not shown). This suggests prices are overextended to the downside and there is a greater risk of a pull back occurring. 

However, RSI has not yet exited the oversold zone, a necessary prerequisite for a buy signal. As things stand, the fact the RSI is oversold is merely a warning for bears not to add to their short positions, it would have to fully rise out of oversold to provide a reversal signal. 

The Moving Average Convergence Divergence (MACD) momentum oscillator has not crossed above its red signal line yet either. This too would be required to provide a buy signal. 

To conclude, there is a risk that although the US Dollar Index has reached a historic low it could simply continue falling unless price action forms a reversal pattern or momentum indicators provide firm buy signals. 

Author

Joaquin Monfort

Joaquin Monfort is a financial writer and analyst with over 10 years experience writing about financial markets and alt data. He holds a degree in Anthropology from London University and a Diploma in Technical analysis.


More from Joaquin Monfort
Share:

Editor's Picks

AUD/USD consolidates above 0.7000; remains close to monthly top

AUD/USD holds steady above 0.7000 during the Asian session on Friday, trading just below the previous day's monthly low amid diverging forces. A hawkish RBA continues to support the Aussie, while the recent decline in US bond yields keeps the US Dollar depressed near a three-week low. However, oil-driven inflation fears reinforce Fed hike bets, which, along with geopolitical risks, could benefit the safe-haven buck and cap the currency pair.

USD/JPY bounces off one-month low; climbs to 157.00 amid reviving USD demand

USD/JPY rebounds from the 156.00 neighborhood, or a one-month low touched during Friday’s Asian session, with bulls looking to extend momentum beyond 157.00 amid the emergence of some US Dollar buying. Meanwhile, Japan's National CPI rose to a nine-month peak and reaffirmed BoJ rate-hike bets, which could support the Japanese Yen and cap gains for the currency pair.

Gold treads water around $4,000

Gold prices maintain its offered stance in place at the end of the week, hovering around the key $4,000 threshold per troy ounce. The persistent selling bias in the precious metal comes amid decent gains in the US Dollar and an acceptable rebound in US Treasury yields across the curve, all alongside further upside traction in crude oil prices.

Crypto Today: Bitcoin holds the 50-day EMA as Ethereum and XRP face structural resistance

Bitcoin gradually ticks up on Friday, trading above $81,000. The Crypto King has recently defended structural support near $80,000, reinforcing the prevailing bullish outlook. Ethereum similarly edges higher above $2,400, while Ripple trades above $1.32 after testing support around $1.30.

The French bond panic is overdone. Here's what the market is misreading 

France's 10-year government bond yield has climbed above 5%, reigniting fears of a sovereign debt crisis in the Eurozone. With public debt exceeding €3.5 trillion, persistent budget deficits and a fragmented political landscape, investors are increasingly questioning the French government's ability to stabilize its finances.

What November 3 means for the Fed's rate path and the US Dollar

The USD faces a decisive period ahead of the November 3 midterm elections. While markets anticipate another interest rate increase from the Fed in December, the battle for control of Congress could reshape fiscal policy expectations and, indirectly, the path of US monetary policy in 2027.

US Dollar Index Price Forecast: Finds floor at long-term historical support level