|

US Dollar Index Price Analysis: DXY off December lows and (almost) out of the woods

  • DXY is showing signs of bullish interest, but bulls need to overcome the 97.25/55 resistances.
  • The level to beat for bulls is the 97.25 resistance.
 

DXY daily chart

 
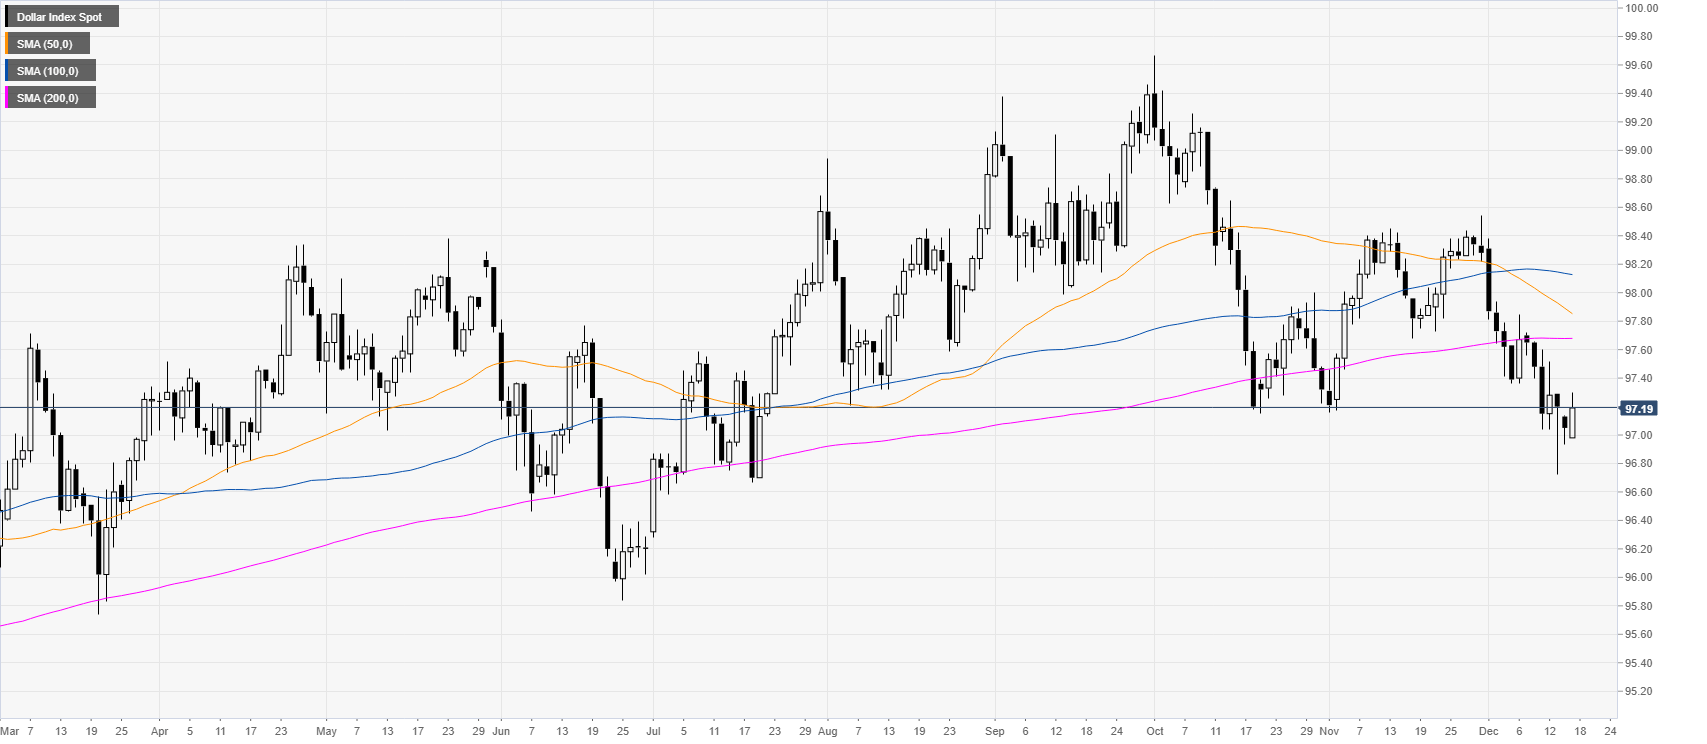
DXY (US Dollar Index) is hovering below the 200-day simple moving average (DMA) while holding above the 97.00 handle for the third consecutive day. 
 

DXY four-hour chart

 
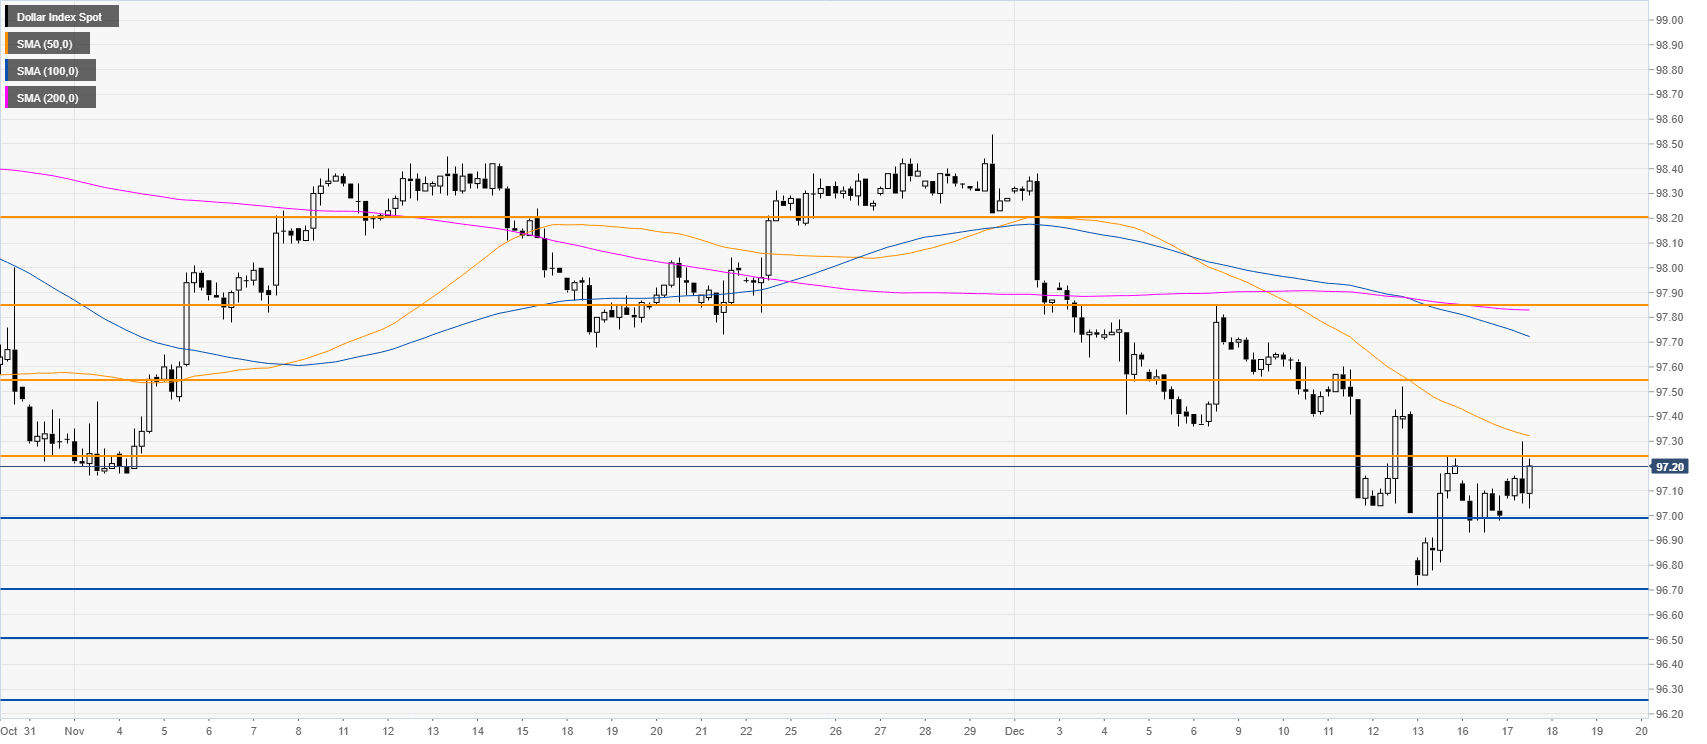
DXY bulls are pressuring the 97.25 resistance as they want to resume the main bull trend. If the market break above the 97.25 level and the 50 SMA, the next resistance is seen at 97.55 and 97.85 level near the 200 SMA. Conversely, a daily close below 96.70 could be seen as a bearish confirmation for further declines towards 96.50 and 96.25.
   

Additional key level

Dollar Index Spot

Overview
Today last price97.2
Today Daily Change0.15
Today Daily Change %0.15
Today daily open97.05
 
Trends
Daily SMA2097.78
Daily SMA5097.89
Daily SMA10098.14
Daily SMA20097.68
 
Levels
Previous Daily High97.14
Previous Daily Low96.93
Previous Weekly High97.72
Previous Weekly Low96.72
Previous Monthly High98.54
Previous Monthly Low97.16
Daily Fibonacci 38.2%97.01
Daily Fibonacci 61.8%97.06
Daily Pivot Point S196.94
Daily Pivot Point S296.83
Daily Pivot Point S396.73
Daily Pivot Point R197.15
Daily Pivot Point R297.25
Daily Pivot Point R397.36

Author

Flavio Tosti

Flavio Tosti

Independent Analyst


More from Flavio Tosti

Share:

Editor's Picks

CLARITY Act approval odds sink fast ahead of Congressional hearing
The United States (US) House Financial Services Committee’s Subcommittee on Digital Assets, Financial Technology, and Artificial Intelligence (AI) is holding a hearing titled “Building the Future of Finance: How the CLARITY Act Unlocks Innovation” on Friday.
Week ahead – Could technology earnings revive equities as geopolitical risks linger?

Oil prices rise, but the dollar posts losses as Middle East tensions persist. US earnings, the ECB and UK newsflow dominate next week’s agenda. US equity markets face a pivotal test as focus shifts to technology earnings.

-0.4%: Why the biggest CPI drop since 2020 couldn't buy back a single cut

The June CPI fell 0.4% on the month, the largest one-month decline since April 2020, dragging the annual rate to 3.5% from May's 4.2% and snapping a three-month acceleration streak. Core prices went nowhere, flat on the month and down to 2.6% YoY, both under consensus.