UK annual CPI inflation rises to 2.2% in July, back above BoE's 2.0% target
- United Kingdom annual CPI increased 2.2% in July vs. the expected 2.3% print.
- British inflation drops 0.2% MoM in July vs. +0.1% previous.
- GBP/USD drops toward 1.2800 after UK CPI inflation data.

The United Kingdom (UK) Consumer Price Index (CPI) rose at an annual rate of 2.2% in July after increasing by 2.0% in June, data released by the Office for National Statistics (ONS) showed on Wednesday.
The reading came in below the market expectations of a 2.3% growth, moving back above the Bank of England’s (BoE) 2.0% target.
Core CPI (excluding volatile food and energy items) advanced 3.3% YoY in July, compared to a 3.5% increment in June while below the market consensus of 3.4%.
The UK July Services CPI inflation fell sharply to 5.2% YoY in July versus June’s 5.7%, still above the 5.0% level.
Meanwhile, the UK Consumer Price Index decreased by 0.2% MoM in July, having registered a 0.1% acceleration in June.
GBP/USD reaction to the UK CPI inflation data
The UK CPI data smashes the Pound Sterling, as the GBP/USD pair drops toward 1.2800. The pair is trading 0.23% lower on the day near 1.2825, as of writing.
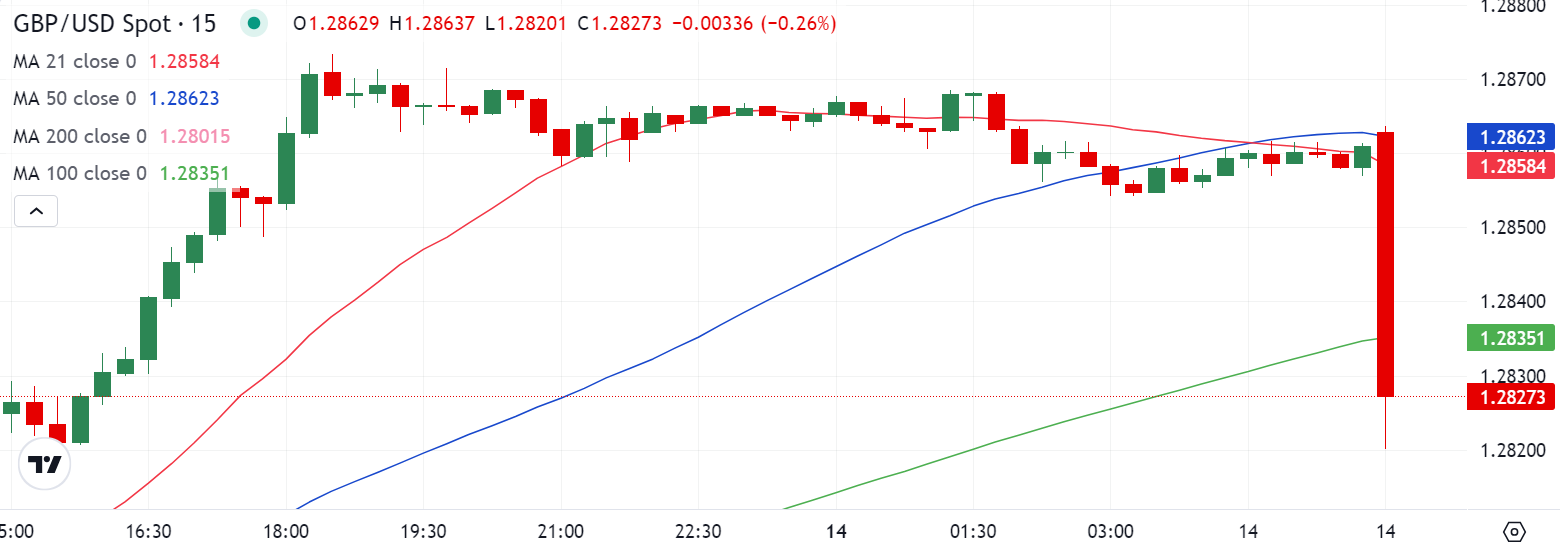
GBP/USD: 15-minutes chart
British Pound PRICE Today
The table below shows the percentage change of British Pound (GBP) against listed major currencies today. British Pound was the weakest against the Swiss Franc.
| USD | EUR | GBP | JPY | CAD | AUD | NZD | CHF | |
|---|---|---|---|---|---|---|---|---|
| USD | 0.04% | 0.28% | 0.13% | 0.09% | -0.02% | 1.05% | -0.04% | |
| EUR | -0.04% | 0.23% | 0.08% | 0.03% | -0.02% | 0.98% | -0.09% | |
| GBP | -0.28% | -0.23% | -0.11% | -0.17% | -0.26% | 0.77% | -0.28% | |
| JPY | -0.13% | -0.08% | 0.11% | -0.05% | -0.15% | 0.87% | -0.14% | |
| CAD | -0.09% | -0.03% | 0.17% | 0.05% | -0.10% | 0.93% | -0.09% | |
| AUD | 0.02% | 0.02% | 0.26% | 0.15% | 0.10% | 1.00% | -0.03% | |
| NZD | -1.05% | -0.98% | -0.77% | -0.87% | -0.93% | -1.00% | -1.01% | |
| CHF | 0.04% | 0.09% | 0.28% | 0.14% | 0.09% | 0.03% | 1.01% |
The heat map shows percentage changes of major currencies against each other. The base currency is picked from the left column, while the quote currency is picked from the top row. For example, if you pick the British Pound from the left column and move along the horizontal line to the US Dollar, the percentage change displayed in the box will represent GBP (base)/USD (quote).
This section below was published at 02:15 GMT as a preview of the UK Consumer Price Index (CPI) data.
- United Kingdom’s CPI is foreseen to tick higher in July to 2.3% YoY.
- The Bank of England acknowledged the battle against inflation is not done.
- The Pound Sterling advances against the US Dollar ahead of key data.
The United Kingdom (UK) will release the Consumer Price Index (CPI) for July on Wednesday, a high-impact macroeconomic event. The data, published by the Office for National Statistics (ONS), directly influences the Bank of England (BoE) monetary policy decision and, hence, the Sterling Pound (GBP).
When policymakers met at the end of July, the BoE trimmed the Bank Rate by 25 basis points (bps) to 5%, as inflation, as measured by the CPI, stood at 2% in May and June, meeting the central bank’s goal.
What to expect from the next UK inflation report?
The UK CPI is expected to have risen at an annual pace of 2.3% in July, above the preferred 2%. Core annual inflation, however, is foreseen at 3.4%, below the 3.5% posted in June.
Nevertheless, the figures are in line with what the central bank anticipated in its latest meeting. The Monetary Policy Committee (MPC) stated that “CPI inflation is expected to increase to around 2¾% in the second half of this year, as declines in energy prices last year fall out of the annual comparison, revealing more clearly the prevailing persistence of domestic inflationary pressures. Private sector regular average weekly earnings growth has fallen to 5.6% in the three months to May, and services consumer price inflation has declined to 5.7% in June.”
Even further, the meeting Minutes showed that the Committee “discussed developments in internationally traded goods prices, noting the presence of a range of risks that could be material for the UK inflation outlook.”
With that in mind, an uptick in inflation figures would not mean an imminent interest rate hike, as policymakers are well aware the road is still bumpy. On the other hand, a rate cut is also out of the picture for now: “Monetary policy will need to continue to remain restrictive for sufficiently long until the risks to inflation returning sustainably to the 2% target in the medium term have dissipated further.”
The main focus will be on services inflation, which held steady at 5.7% year-over-year (YoY) in June after rising by more than expected for two months in a row. Easing services inflation will be read as good news and seen as anticipation of a potential rate cut when the BoE meets in November.
When will the UK Consumer Price Index report be released and how could it affect GBP/USD?
In the present scenario, upcoming UK CPI data will likely be taken with a pinch of salt. As said, the expected increase in annual inflation figures won’t twist policymakers’ hands but instead fall within expectations. Higher-than-expected figures, however, may spur speculation about a more hawkish BoE and a potential delay for the next interest rate cut to 2025. In such a case, the Pound Sterling may edge higher against its major rivals.
The opposite case is also valid: a lower-than-anticipated outcome in CPI figures will boost the odds for a soon-to-come rate cut and weigh on the British currency. There is still another – quite unlikely – scenario: Annual CPI falling below 2%. This will push speculative interest into pricing in a sooner-to-come rate cut and could result in GBP plummeting.
Valeria Bednarik, FXStreet's Chief Analyst, analyzes the possible GBP/USD scenarios following the release of the UK CPI figures: “The GBP/USD pair fluctuates around the 1.2800 mark ahead of the announcement, as demand for the US Dollar receded following a week dominated by risk-aversion. The pair bottomed at 1.2664 last week, a potential bearish target should the annual CPI ease to below 2%. On the contrary, a reading above 2.5% may push GBP/USD towards the 1.2900 region.”
Technically speaking, Bednarik adds: “The bullish potential seems limited, according to the daily chart. Despite advancing, technical indicators remain within negative levels. Furthermore, the positive momentum seems to be easing ahead of the announcement. At the same time, the pair develops below a firmly bearish 20 Simple Moving Average (SMA), currently providing dynamic resistance at around 1.2830. Finally, the 100 and 200 SMAs stand directionless below the current level, suggesting buying interest is not firm enough to put the pair on a continued bullish path.”
Author
FXStreet Team
FXStreet
Composed of a group of economic journalists and FX experts, the FXStreet content team produces and oversees all content published on FXStreet. It provides a purely journalistic approach to the Forex market.


