UBER Technologies Stock: UBER stalled out at strong support near $49
- UBER has traded near $49 for several weeks.
- Q1 results were an improvement and revenue continues to grow.
- Technicals give few bright spots for near-term optimism.

Shares of pioneering rideshare and delivery service Uber Technologies (NYSE: UBER) have been dawdling around $49 for the past three weeks. Though the price appears to be at a worthy support level, there is little of any impending break out to the upside. UBER stock is flat in Thursday’s premarket near the previous day’s close of $48.89.
UBER stock technicals and valuation: Stuck in neutral
It is best to begin with the positives since there is not much near-term cheer to go around. On a monthly chart basis, UBER shares are above many of its long-term moving averages, which may warm the hearts of long-term investors and provide impetus for new investors to join the fray. The 20-month moving average sits at $40.06, providing long-term downside protection about 20% below current prices.
UBER Q1 earnings also surprised by 89%, with the company losing 6 cents a share rather than the $0.54 expected by analysts. Lastly, with 2021 revenue expected at $15.6 billion for the year, UBER trades at a discount to main US competitor Lyft, although it has about five times the market share. Analysts’ consensus price target is $68.64, a 29% premium to the current share price.
Upon raising UBER shares off their May low of $43.17, traders fell short in the region around $51.70 during the first two weeks of June. Shares have dropped to support near $49. The $49 region may have longevity. It acted as support multiple times in November and December of 2020 and has acted as a stabilizing force over the past three weeks. This line of defence may fall short if UBER stock closes below $48.
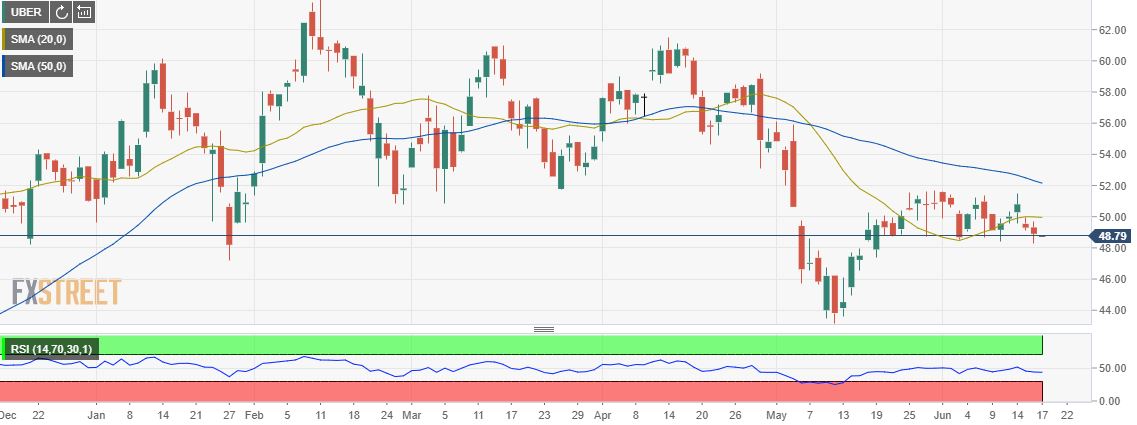
UBER daily chart
Despite this region’s perseverance, bears can be forgiven for their pessimism. After all, UBER has been rejected at the midpoint of the Relative Strength Index (RSI) three times in a row over the past three weeks on the daily chart and now sits just below 44. This may be an ominous sign that UBER stock is in for more red. Additionally, UBER closed below the 9-day, 20-day and 50-day Simple Moving Averages (SMAs), the former two of which sit just below $50 and act as resistance.
Support can be found at $43.81, the close from May 12. If UBER were to rally above $51.70, the next target for bulls would be the 50-day SMA at $52.32. After surmounting this obstacle, the point where the 20-day crossed under the 50-day SMA on May 7, $55.91, would likely offer substantial resistance.
Author

Clay Webster
FXStreet
Clay Webster grew up in the US outside Buffalo, New York and Lancaster, Pennsylvania. He began investing after college following the 2008 financial crisis.
















