Tesla Stock Price and Forecast: Three reasons why TSLA stock keeps dropping. $630 our strong support
- Tesla shares dropped nearly 2% on Wednesday in the first 30 minutes.
- TSLA has struggled to maintain gains above $667.
- Tesla stock broke $635 in a powerful surge and then $667, but has been stuck in volume traffic since.

Update: China woes continue to provide some headwinds for Tesla as a weak session on Tuesday is followed by another poor start to Wednesday. Concerns over data issues with Chinese companies is having some read across for Tesla as the shares struggled to maintain gains in the heavy volume resistance area above $675. At the time of writing shares in tesla are trading $650.32, a loss of 1.4%. This is a potential buy the dip zone but it is not too strong so please use a tight stop. Stronger support is near $630 where the move initially kicked on from and the 200-day moving average.
Tesla shares dropped sharply on Tuesday as the recent run and strong trend saw a sharp retracement. The shares closed down nearly 3% at $659.58. In the process it broke back below the $667 level that was previously identified.
Tesla key statistics
| Market Cap | $635 billion |
| Price/Earnings | 679 |
| Price/Sales | 23 |
| Price/Book | 29 |
| Enterprise Value | $753 billion |
| Gross Margin | 0.21 |
| Net Margin |
0.03 |
| Average Wall Street Rating and Price Target | Hold, $657 |
Why did Tesla stock fall yesterday
One word, DIDI. Or another word if you prefer, China. The DIDI saga (see more) is ongoing and basically sees China cracking down on the ride-haling company and others over concerns about the vast amount of data on Chinese citizens its operations produce. China is high on data concerns and had previously taken a similiar step in tackling concerns over the IPO of ANT Group, an Alibaba (BABA) subsidiary. The situation there was slightly different perhaps as Jack Ma was apparently critical of Chinese authorities, but the same underlying tenets existed. ANT Group also generated a huge amount of customer data. The Wall Street Journal reported on June 23 that ANT Group was in discussions with Chinese state-owned enterprises to form a credit scoring company, so that ANT Group's data was under Chinese regulatory control.
So why Tesla? Well, Tesla has some history with Chinese authorities also. Reuters reported on May 25 that Tesla had set up a local site in China to store car data. A previous story from Reuters on May 21 reported that Tesla cars were barred from some government compounds due to concerns over cameras installed in the Tesla vehicles.
Wedbush analyst Daniel Ives said, "The Didi move from Beijing has sent nervousness to China-exposed names such as Tesla. [...] China and Tesla continue to be in a regulatory back and forth that is concerning investors."
Also perhaps weighing on Tesla was a tweet sent by Tesla CEO Elon Musk over the weekend in which he said he did not expect self-driving to be too difficult. "Generalized self-driving is a hard problem, as it requires solving a large part of real-world AI. Didn’t expect it to be so hard, but the difficulty is obvious in retrospect. Nothing has more degrees of freedom than reality."
I did promise three reasons, well that was two,
1. Concerns over China regulatory scrutiny from the DIDI saga.
2. Elon Musk's tweet about how self-driving is difficult.
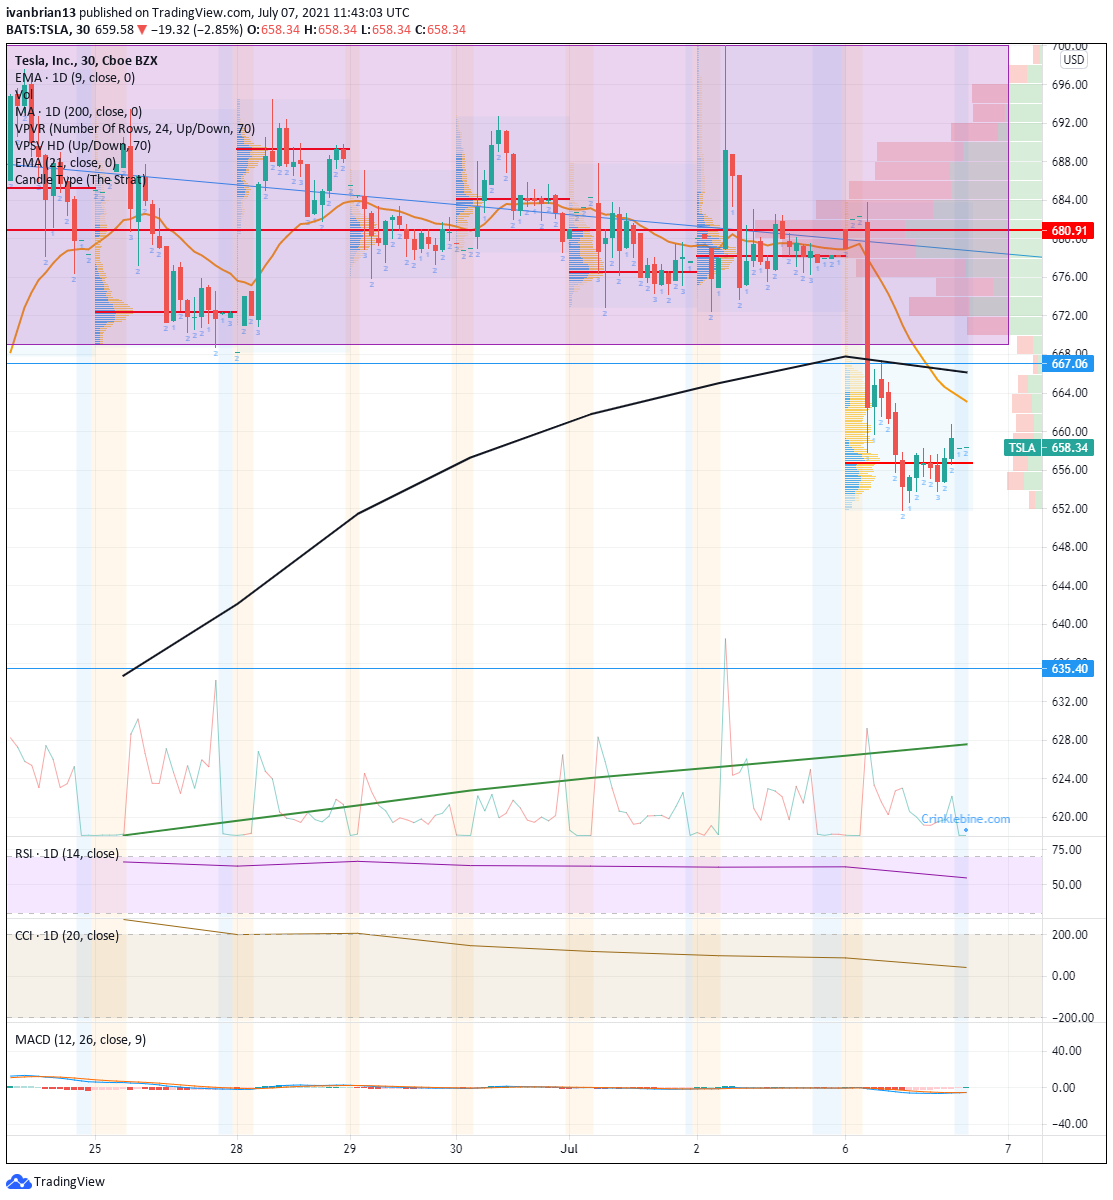
3. The break below through $667 was a technically bearish move, and a lack of volume meant no support below. This can be seen clearly on the short-term chart below.
Tesla stock forecast
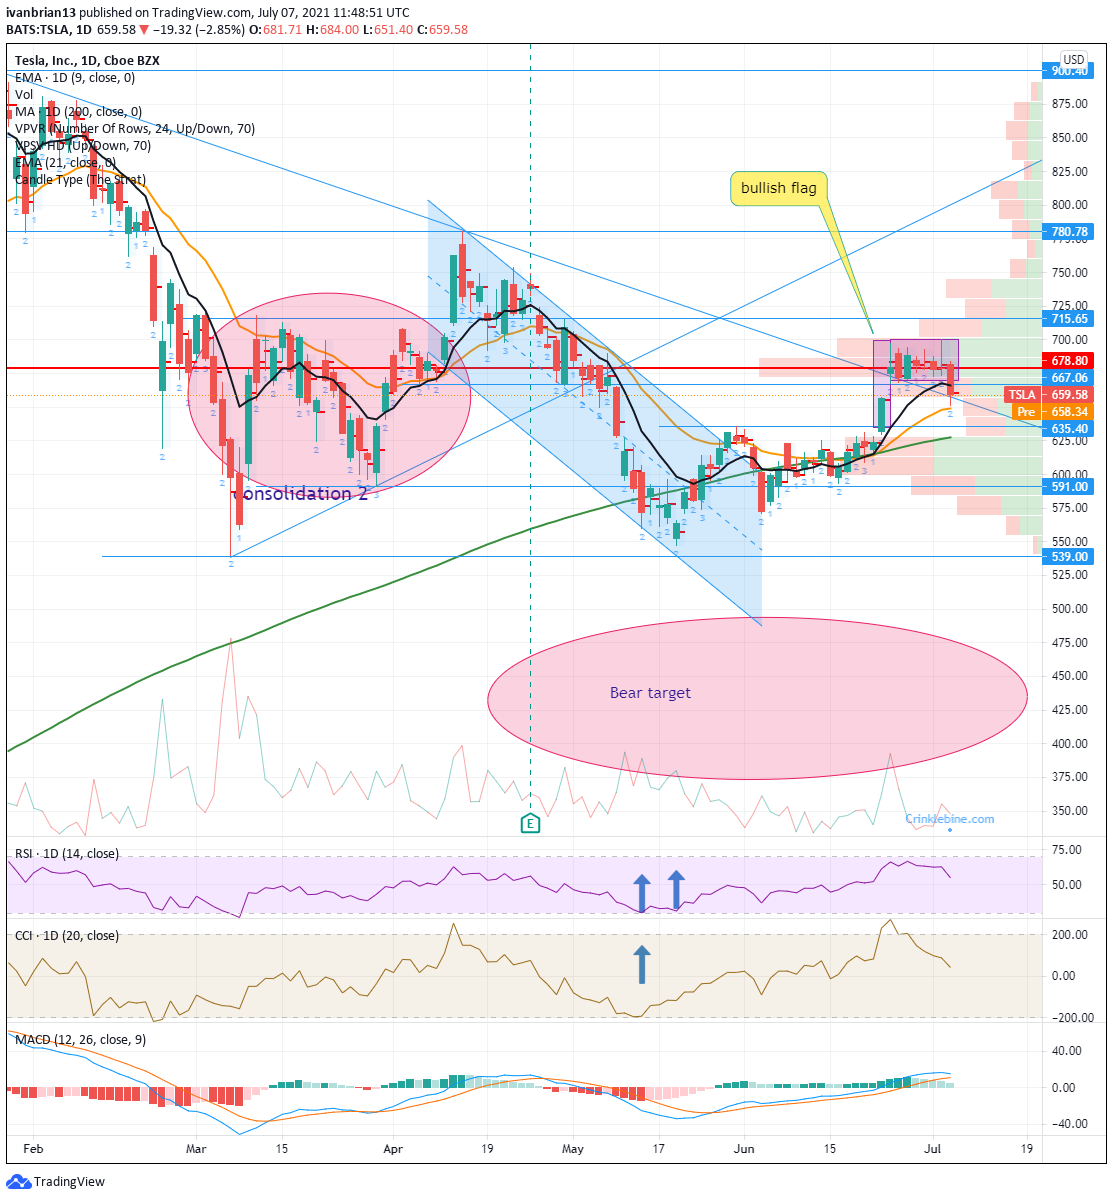
Tuesday's move was a strong one and has put the recent upward move in serious doubt. We had been focusing on the potential for a bullish flag breakout. We got the breakout, but unfortunately to the wrong side. Now TSLA stock has retraced to the long-term downtrend line and the 21-day moving average. This is not a bad area of support and may be one area where traders buy the dip. It is definitely a support zone but not too strong due to the volume profile. There is not a lot of recent volume at this level. If you are itching to get long, then $658 is as good as you will get before $635.
Be careful though. As we saw on the break higher through $635, zones with light volume can often lead to an acceleration in price. It is best to use a tight stop. Stronger support is at the $630-635 zone where the move initially ignited from. Down at this level, there is a lot more volume-based support, as well as the 200-day moving average.
Like this article? Help us with some feedback by answering this survey:
Author

Ivan Brian
FXStreet
Ivan Brian started his career with AIB Bank in corporate finance and then worked for seven years at Baxter. He started as a macro analyst before becoming Head of Research and then CFO.


