SPDR S&P 500 ETF Trust (SPY) News and Forecast: This cat is dead, no bounce, no pulse
- SPY falls again on Thursday to see off a shaky September.
- So far same again for Friday and the SPY as European markets slip.
- SPY chart looking increasingly bearish as good news is slim.

The S&P 500 (SPY) ETF bade farewell to September yesterday with another losing session, the fourth in a row for the index. This time it cannot blame the Nasdaq for dragging things lower as that was actually the top index performer on the day. Tech and Nasdaq stocks have largely led recent declines as yields globally have soared and the US 10-year popped back above 1.5%. While yields have calmed today, the situation is unlikely to get much better as Eurozone inflation numbers hit a 13-year high and Fed Chair Powell has been forced to admit that inflation may not be transitory after all.
It is not just inflation that is the problem but supply bottlenecks as well. The Suez canal blockage seems like a while ago now, but this was merely a starter for what is now serious shipping problems alluded to by practically every global company releasing results lately. Shipping costs have trebled, and these will be passed onto consumers, once the actual products make it to their endpoints. Clothing and apparel manufacturers are having serious issues with supply from Vietnam as it is a major global clothing producer. Concerns over inflation rose earlier this year but were successfully batted away by a slew of Central Bank doves. Not possible this time around. Inflation is back, and it is here to stay.
S&P 500 SPY stock forecast
-637686854875230593.png)
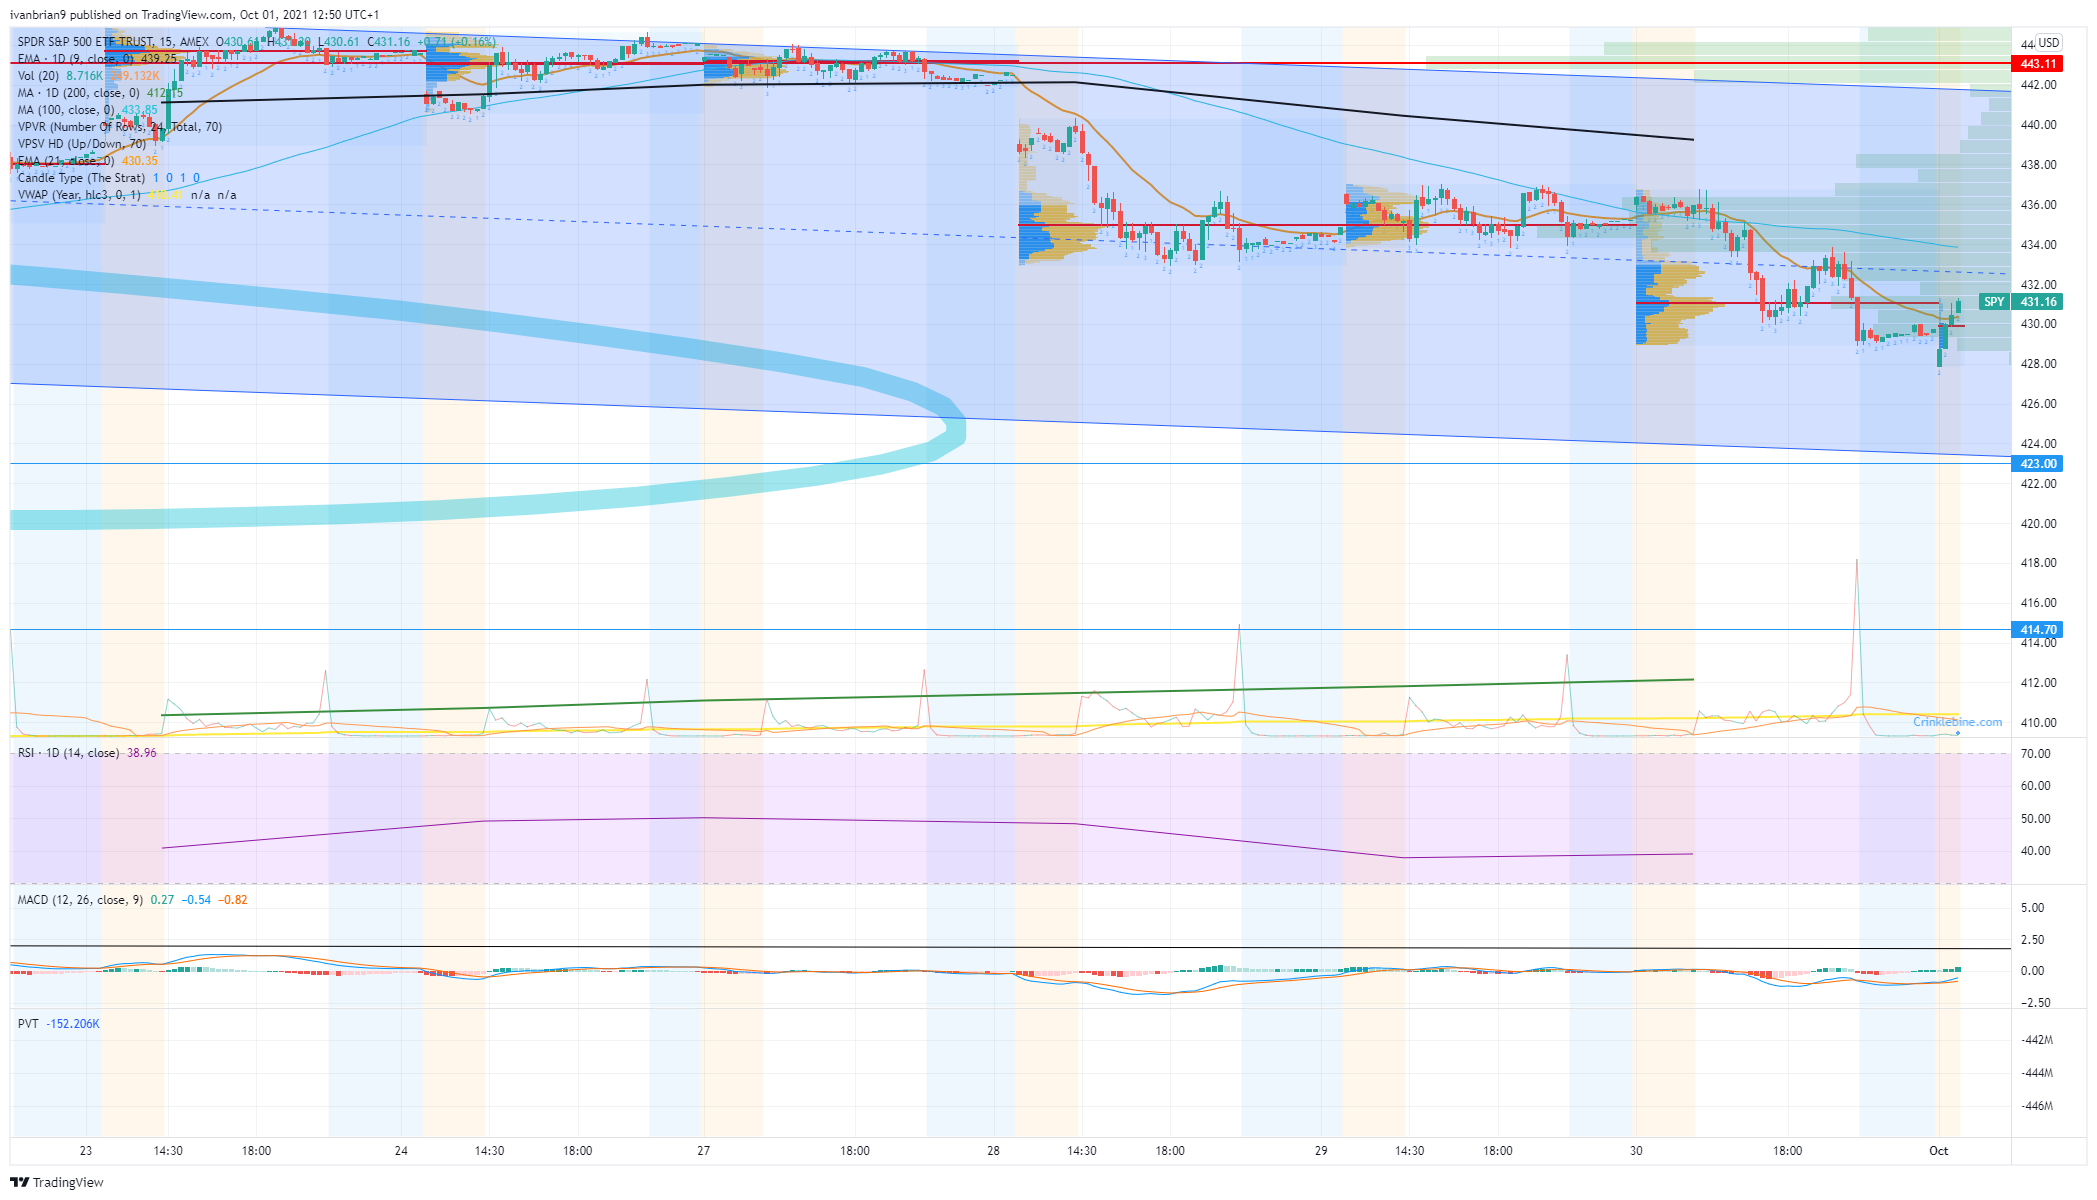
Look at that ugly 15-minute chart above. Yesterday (Thursday) before the open we identified $433 as being key for the day: "Below look for further losses but opening above can lead us to retrace a bit and test the 9-day moving average at $439." Well, the SPY did open above but failed to make much headway, topping out early at $437 and so failing to retake the 9-day moving average. This $437 top also worked well on Wednesday, and the failure led the SPY back to our $433 level and pivot for the day. Once below, we got the perfect retest and failure, closing at $429.
Nothing much has changed for Friday, $434 to $436 is much of the recent volume as we can see the volume profile bars are large here on the 15-minute chart below. This is short-term resistance, getting above can and should see a quick move to $443.
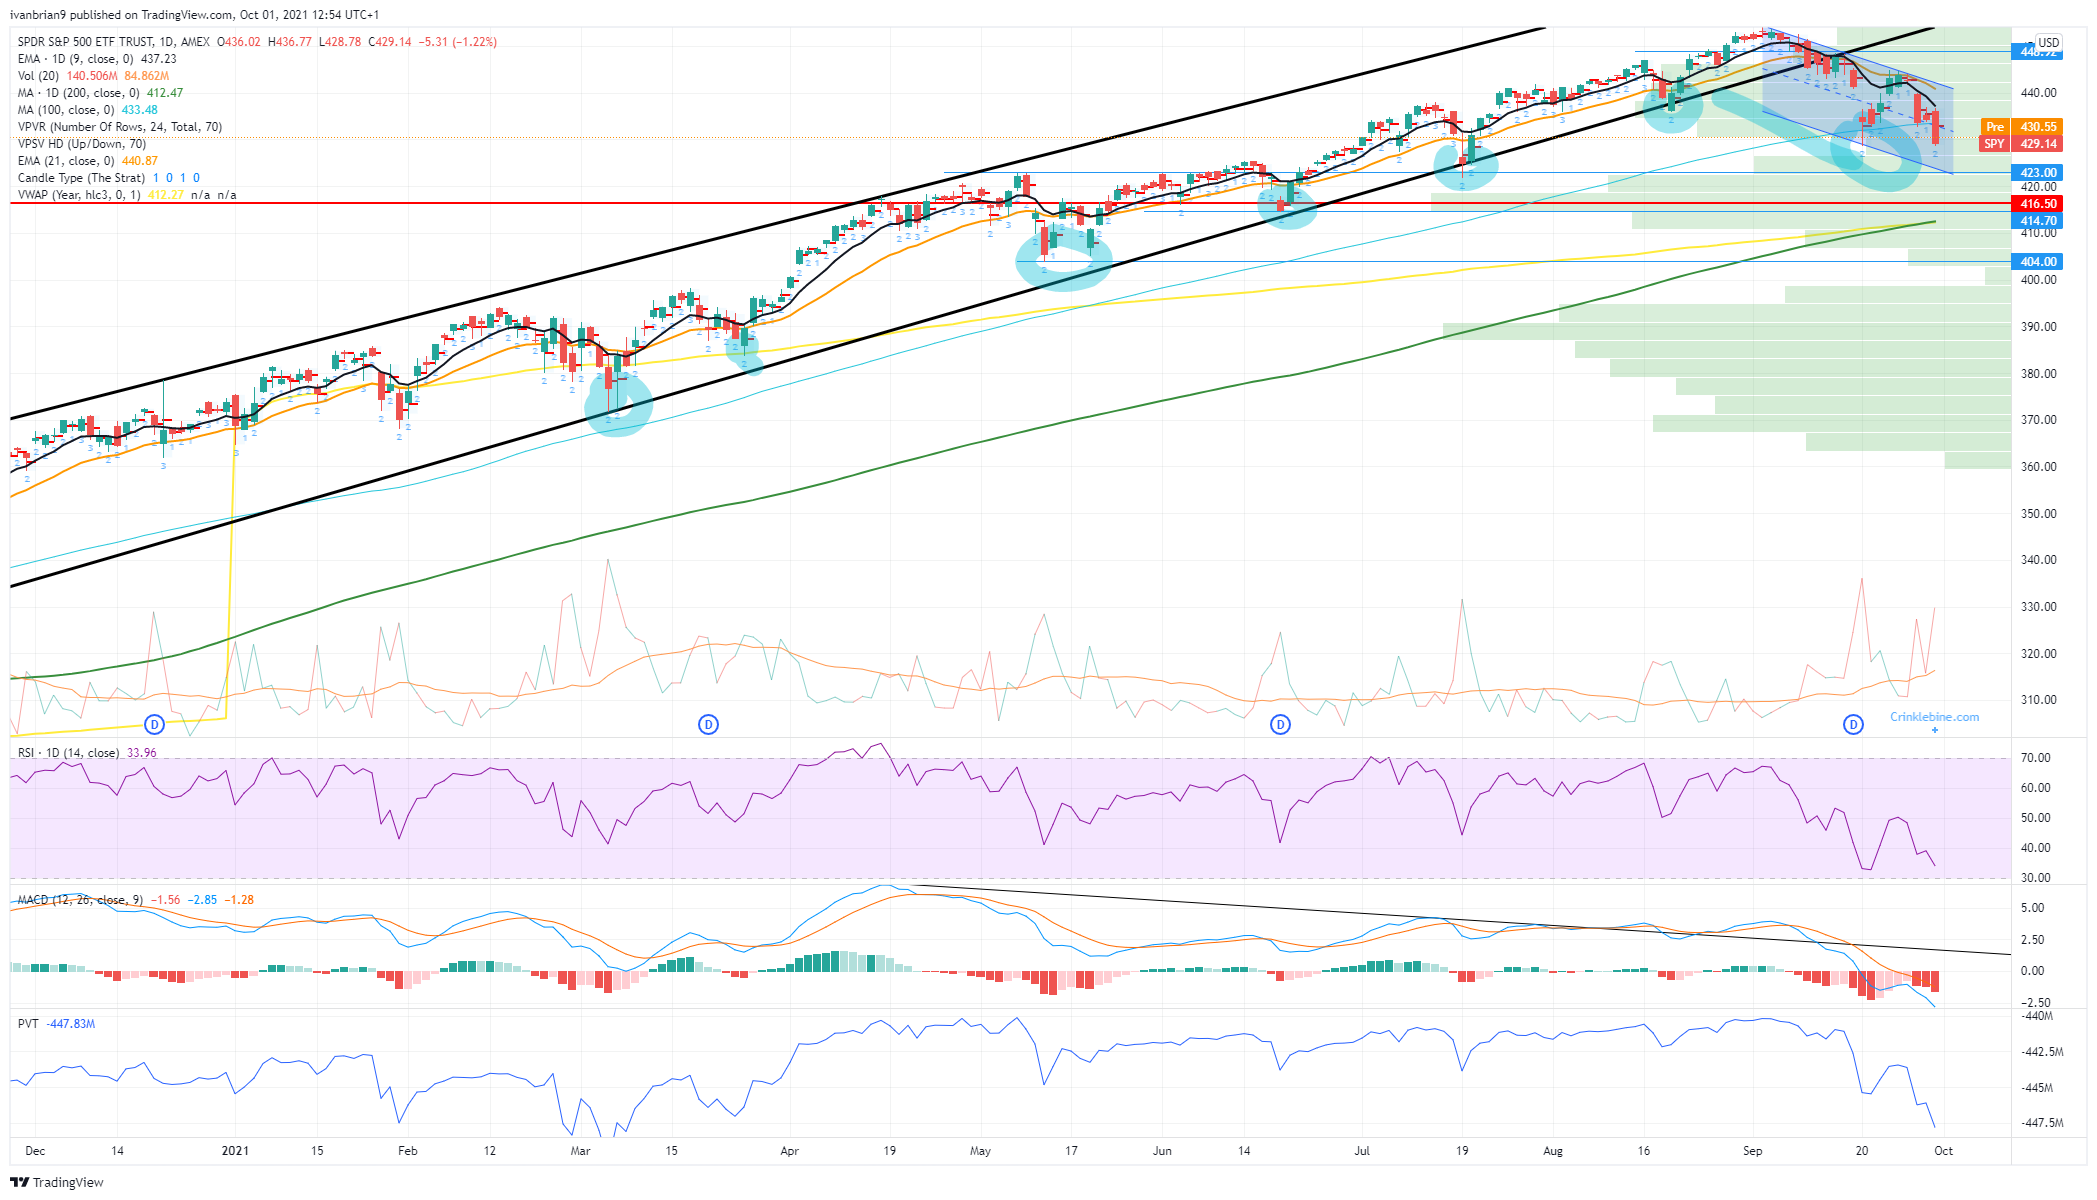
On the daily chart below we can see the big levels in play. Breaking $428 is important to bears, as otherwise, we may have just put in a double-bottom, which is a bullish reversal. Also below $428 volume thins out, meaning we would expect a quick move to $415. This is our buy-the-dip zone with a huge volume profile and the yearly Volume Weighted Average Price (VWAP) and 200-day moving average at $413 to $415.
Premium
You have reached your limit of 3 free articles for this month.
Start your subscription and get access to all our original articles.
Author

Ivan Brian
FXStreet
Ivan Brian started his career with AIB Bank in corporate finance and then worked for seven years at Baxter. He started as a macro analyst before becoming Head of Research and then CFO.


