S&P 500 wraps up the week in red after tanking to June lows amid Fed’s hawkish stance
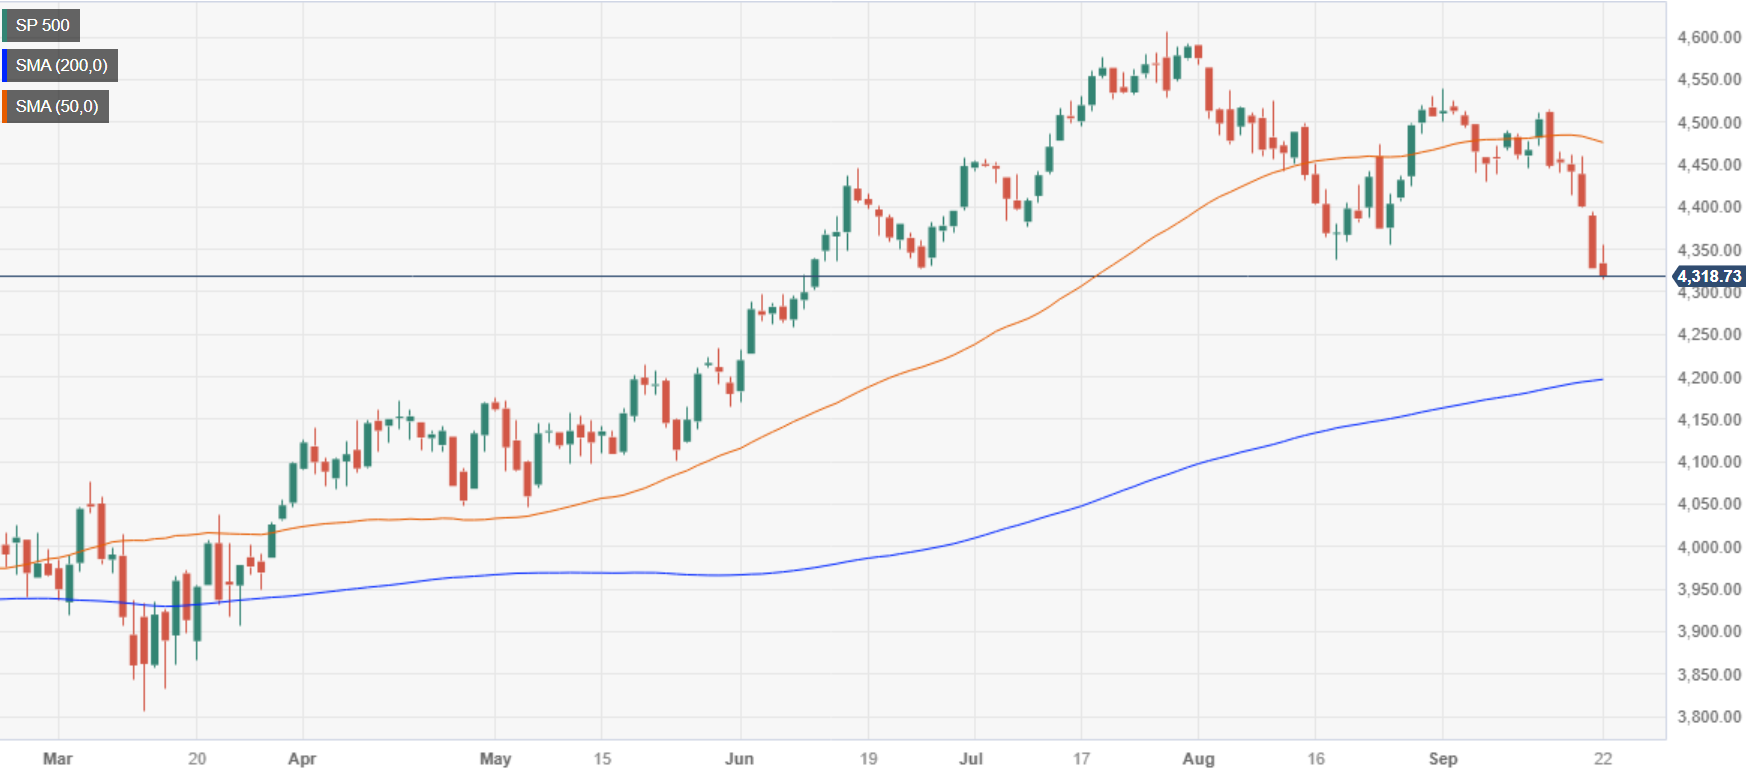
- S&P 500 concluded the week at 4,320.06, marking a 0.23% daily and a 3.02% weekly drop, reaching levels last seen in June, with Nasdaq and Dow Jones also incurring losses
- Federal Reserve’s decision to hold rates but revise upward projections for the Federal Funds rate for 2023 and 2024 spurred a sharp reaction in financial markets.
- Sector-wise, Technology and Energy emerged as gainers, while Consumer Discretionary, Financials, and Real Estate were the laggards.

Wall Street finished the week on a lower note, mixed with the S&P 500, the Nasdaq, and the Dow Jones printing losses. Additionally, US equities plunged, led by the S&P 500 dropping to levels last seen in June.
S&P 500 plunges weekly, Nasdaq and Dow follow suit, as markets react to Federal Reserve’s upward revision of Federal Funds Rate projections
The S&P finished Friday’s session at 4,320.06, dropping 0.23%, but plunged -3.02% weekly. The heavy-tech Nasdaq edged lower by a minimal 0.09% and sank 3.21% weekly, while the Dow Jones Industrial dived 0.31% at 33,963.84 and slumped -1.89% in the week.
Sector-wise, the biggest gainers were Technology and Energy, each gained 0.26% and 0.15%. The laggards were Consumer Discretionary, Financials, and Real Estate, erasing from its value 0.87%, 0.74%, and 0.72%, respectively.
During the week, the Federal Reserve held the sixth monetary policy meeting, in which the US central bank decided to hold rates but upward revised their projections to the Federal Funds rate (FFR). For 2023, policymakers expect the FFR to end at 5.60%; for 2024, they increased their estimates from 4.6% to 5.1%.
The data spurred an aggressive reaction in the financial markets, with US equities plummeting sharply after hitting fresh weekly highs. US Treasury bond yields touched 16-year highs, led by 2s, 5s and 10s. Nevertheless, as traders booked profits before the weekend, US bond yields retraced, though they failed to undermine the Greenback.
Data-wise, S&P Global announced the final PMI readings in the United States (US). Manufacturing PMI improved to 48.9 but stood at recessionary territory. Contrarily, Services and Composite PMI showed signs of losing steam, though it expanded but continued to aim towards the 50 expansion/contraction threshold.
US Treasury bond yields finished the session with the 10-year benchmark note rate at 4.36%, lost 1.33%. The Greenback, as shown by the US Dollar Index, ended positively, climbing 0.19% to 105.58.
WTI rose by 0.85% daily in the commodity space underpinned by tight supply concerns stemming from Russia’s fuel export ban.
S&P 500 Price Action – Daily Chart
S&P 500 Technical Levels
Author

Christian Borjon Valencia
FXStreet
Markets analyst, news editor, and trading instructor with over 14 years of experience across FX, commodities, US equity indices, and global macro markets.