S&P 500 reclaims $4,300 after post-NFP market surge


  • US equities caught a firm bid on Friday after a bumper NFP beat.
  • The S&P 500 has pinged a new high for the week as investors pile out of safe havens to close out the trading week.
  • Inflation data for the US will be the key focus moving forward as markets watch the Fed carefully.

The Standard & Poor's (S&P) 500 soared late Friday into $4,305 after markets yanked out the stopper and went full risk-on after US Non-Farm Payrolls handily beat the street, printing at a forecast-clobbering 336K against the anticipated 170K, and the previous figure was also revised higher to 227K from 187K.

US Nonfarm Payrolls soar by 336,000 in September vs. 170,000 forecast

US equities have been knocked lower as of late, crushed underfoot by rising US Treasury yields. Investors, fearing that still-high inflationary pressures will keep the Federal Reserve (Fed) stuck in a higher-for-longer rate cycle.

Next week sees US Producer Price Index (PPI) numbers and the latest draft of the Fed's meeting minutes, and investors will be turning an eye towards next week's Consumer Price Index (CPI) to re-focus on inflation pressures after Friday's focus shift.

US: All eyes will be on inflation data – RBC

S&P 500 technical outlook

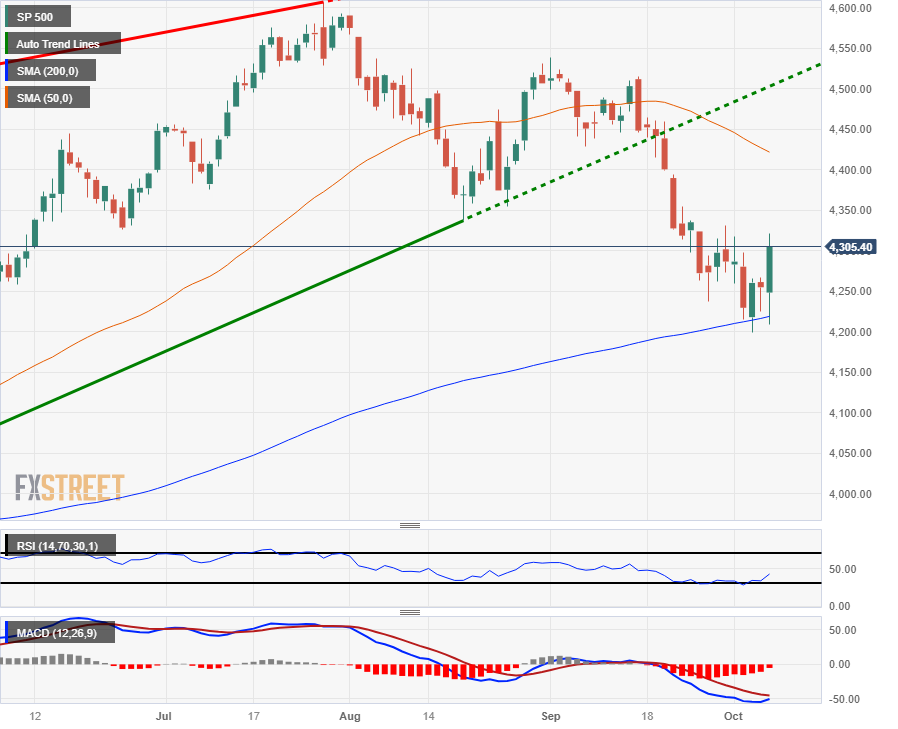
The S&P 500 closed out the trading week at $4,305 after tapping a new weekly high of $4,321.94. The major US equity index fell to an intraday low of $4,208.68 on reaction to the bumper NFP reading, before market sentiment shifted into high gear and giving the S&P a much-needed rebound into a new high for the week.

On the daily candlesticks the S&P 500 is in desperate need of a bullish extension after seeing a bullish rejection from the 200-day Simple Moving Average (SMA) near $4,220, but the index still remains firmly bearish, still down 6.5% from July's peak of $4,607, and is still stuck below technical resistance from the 50-day SMA at $4,421.78.

S&P 500 daily chart

S&P 500 technical levels

SP 500

Overview
Today last price 4305.4
Today Daily Change 50.39
Today Daily Change % 1.18
Today daily open 4255.01
 
Trends
Daily SMA20 4363.1
Daily SMA50 4427.24
Daily SMA100 4400.02
Daily SMA200 4219.28
 
Levels
Previous Daily High 4266.49
Previous Daily Low 4224.64
Previous Weekly High 4337.8
Previous Weekly Low 4237.48
Previous Monthly High 4538.24
Previous Monthly Low 4237.48
Daily Fibonacci 38.2% 4240.63
Daily Fibonacci 61.8% 4250.5
Daily Pivot Point S1 4230.94
Daily Pivot Point S2 4206.86
Daily Pivot Point S3 4189.09
Daily Pivot Point R1 4272.79
Daily Pivot Point R2 4290.56
Daily Pivot Point R3 4314.64


Share: Feed news

Information on these pages contains forward-looking statements that involve risks and uncertainties. Markets and instruments profiled on this page are for informational purposes only and should not in any way come across as a recommendation to buy or sell in these assets. You should do your own thorough research before making any investment decisions. FXStreet does not in any way guarantee that this information is free from mistakes, errors, or material misstatements. It also does not guarantee that this information is of a timely nature. Investing in Open Markets involves a great deal of risk, including the loss of all or a portion of your investment, as well as emotional distress. All risks, losses and costs associated with investing, including total loss of principal, are your responsibility. The views and opinions expressed in this article are those of the authors and do not necessarily reflect the official policy or position of FXStreet nor its advertisers. The author will not be held responsible for information that is found at the end of links posted on this page.

If not otherwise explicitly mentioned in the body of the article, at the time of writing, the author has no position in any stock mentioned in this article and no business relationship with any company mentioned. The author has not received compensation for writing this article, other than from FXStreet.

FXStreet and the author do not provide personalized recommendations. The author makes no representations as to the accuracy, completeness, or suitability of this information. FXStreet and the author will not be liable for any errors, omissions or any losses, injuries or damages arising from this information and its display or use. Errors and omissions excepted.

The author and FXStreet are not registered investment advisors and nothing in this article is intended to be investment advice.

Recommended content


Recommended content

Editors’ Picks

AUD/USD faces formidable resistance around 0.6600

AUD/USD faces formidable resistance around 0.6600

AUD/USD resumed its weekly pullback on Thursday, this time accelerating its losses to the 0.6450 region on the back of the stronger US Dollar, while disheartening prints from the Australian labour market also contributed to the sour mood around the Aussie.

EUR/USD: Losses could pick up pace below 1.1470

EUR/USD: Losses could pick up pace below 1.1470

EUR/USD remained on the back foot and slipped back to fresh multi-week lows near 1.1550 on Thursday, always in response to the improved sentiment surrounding the Greenback, which in turn extended its upside momentum on the back of firmer data from key fundamentals.

Gold trades with modest losses near $3,340

Gold trades with modest losses near $3,340

Gold remains in auto-pilot around the $3,340 zone per troy ounce as the NA session draws to a close on Thursday. The yellow metal's negative trend stems from the extra improvement in the dollar, rising US yields, and some relief from trade concerns.

XRP price just 5% from record high as Ripple eyes Dubai's tokenized real estate market

XRP price just 5% from record high as Ripple eyes Dubai's tokenized real estate market

Ripple's (XRP) uptrend paces toward new all-time highs, but is trading at around $3.25 on Thursday, after a remarkable recovery from a support level tested at $2.80 on Tuesday.

China’s first-half growth remains on track, though activity data signals caution

China’s first-half growth remains on track, though activity data signals caution

China's second-quarter GDP beat forecasts again with a 5.2% year-on-year growth, driven by strong trade and industrial production. Yet sharper-than-expected slowdowns in fixed-asset investment and retail sales and falling property prices are a concern.

Best Brokers for EUR/USD Trading

Best Brokers for EUR/USD Trading

SPONSORED Discover the top brokers for trading EUR/USD in 2025. Our list features brokers with competitive spreads, fast execution, and powerful platforms. Whether you're a beginner or an expert, find the right partner to navigate the dynamic Forex market.

Forex MAJORS

Cryptocurrencies

Signatures

Best Brokers of 2025