S&P 500 News: Biggest week of the summer ahead with earnings and FOMC meeting
- S&P 500 added 0.69% last week but closed well off intra-week high.
- Last week set up a bearish evening star doji pattern on the S&P 500 daily chart.
- Nearly one-third of the S&P 500 reports earnings this week.
- FOMC meeting on Wednesday will end with decision on fed funds rate.
- Microsoft, Meta Platforms, Alphabet and Visa release quarterly results.

The S&P 500 should experience higher-than-normal volatility this week as a number of newsworthy events converge to buffet the index in both directions. The index rose 0.69% last week as earnings season got underway, but the daily chart ended the week with an evening star doji pattern that typically forecasts a bearish reversal.
All eyes are on the Federal Reserve this week as July’s Federal Open Market Committee (FOMC) meeting takes place on Tuesday and Wednesday. Following Wednesday’s meeting, the FOMC will announce its decision on whether to raise the fed funds rate. The market wholeheartedly expects a 25-basis-point hike.
Throughout the week, the stock market’s largest companies will release their second-quarter results. Domino’s Pizza (DPZ) comes on Monday, followed by Microsoft (MSFT) and Visa (V) on Tuesday. Then Meta Platforms (META) and Coca-Cola (KO) release on Wednesday before Mastercard (MA) and McDonald’s (MCD) announce on Thursday. On Friday, Exxon Mobil (XOM) and Procter & Gamble (PG) finish off the week.
At the time of writing in Monday’s first hour of trading, S&P 500 futures are advancing 0.42%, while NASDAQ 100 futures rise 0.17%. Dow Jones futures are also in the green gaining 0.50%.
S&P 500 News: Earnings to lead the week's headlines
Almost one-third of the S&P 500 component companies – about 150 or more – will release earnings this week. Positive results or beats from the largest companies should push the index higher of course, while major misses could lead to a sea change in sentiment that ushers it lower.
Monday begins with Domino’s Pizza, one of the best-performing stocks of the last 15 years. Wall Street expects the pizza chain to earn $3.07 in GAAP earnings per share (EPS) on $1.07 billion.
The biggest company to report this week is Microsoft on Tuesday. There will be lots of high fives all around if the software king can beat Wall Street consensus of $2.55 in GAAP EPS on $55.5 billion in sales.
Alphabet (GOOGL) reports after the market closes on Tuesday as well. Analyst consensus is $1.34 in GAAP EPS on $72.75 billion in revenue.
Major telecommunications “failsons” Verizon (VZ) and AT&T (T) report earnings on Tuesday and Wednesday, respectively. Verizon is expected to report $1.15 in GAAP EPS on $33.32 billion in sales, while AT&T's consensus is at $0.61 in GAAP EPS on $29.95 billion in sales. Both stocks have lost plenty of ground year to date despite being beloved by dividend investors.
Meta Platforms — the owner of Facebook, Instagram and now Threads — reports late Wednesday as well. The market will watch to see if the social media leader has earned its 136% return year to date. Analyst consensus averages $2.91 per share in GAAP EPS on sales of $31.03 billion.
Exxon Mobil has had a more challenging quarter than initially expected, with global oil prices somewhat moderating. Wall Street is counting on $2.03 in GAAP EPS on revenue of $90.32 billion.
Market expects Fed to hike 25 bps on Wednesday
Fed Chair Jerome Powell will follow up the central bank’s decision on interest rates this Wednesday with further color on the state of the US economy in his post-meeting speech. Since the market is nearly certain in its belief that the Fed will raise the fed funds rate on Wednesday, the S&P 500 will likely move more based on the Chair’s guidance for upcoming meetings.
After June’s FOMC meeting, Powell predicted that the central bank would raise rates at two more meetings though it kept rates still in June. For the July meeting, the CME FedWatch Tool gives a 99.8% probability of a 25 bps rate hike. This would push the fed funds rate up to the 5.25% to 5.5% range.
The rate hike is largely priced in at the moment, but more hawkish rhetoric from the Fed Chair could lead to a sell-off among bank stocks. Inflation data has been quite impressive over the past few months, with the July core CPI inflation rate dropping to 4.8%. The US labor market has begun to loosen more recently, but the central bank appears unlikely to begin cutting interest rates until core CPI rate nears its 2% mandate.
Fed FAQs
What does the Federal Reserve do, how does it impact the US Dollar?
Monetary policy in the US is shaped by the Federal Reserve (Fed). The Fed has two mandates: to achieve price stability and foster full employment. Its primary tool to achieve these goals is by adjusting interest rates.
When prices are rising too quickly and inflation is above the Fed’s 2% target, it raises interest rates, increasing borrowing costs throughout the economy. This results in a stronger US Dollar (USD) as it makes the US a more attractive place for international investors to park their money.
When inflation falls below 2% or the Unemployment Rate is too high, the Fed may lower interest rates to encourage borrowing, which weighs on the Greenback.
How often does the Fed hold monetary policy meetings?
The Federal Reserve (Fed) holds eight policy meetings a year, where the Federal Open Market Committee (FOMC) assesses economic conditions and makes monetary policy decisions.
The FOMC is attended by twelve Fed officials – the seven members of the Board of Governors, the president of the Federal Reserve Bank of New York, and four of the remaining eleven regional Reserve Bank presidents, who serve one-year terms on a rotating basis.
What is Quantitative Easing (QE) and how does it impact USD?
In extreme situations, the Federal Reserve may resort to a policy named Quantitative Easing (QE). QE is the process by which the Fed substantially increases the flow of credit in a stuck financial system.
It is a non-standard policy measure used during crises or when inflation is extremely low. It was the Fed’s weapon of choice during the Great Financial Crisis in 2008. It involves the Fed printing more Dollars and using them to buy high grade bonds from financial institutions. QE usually weakens the US Dollar.
What is Quantitative Tightening (QT) and how does it impact the US Dollar?
Quantitative tightening (QT) is the reverse process of QE, whereby the Federal Reserve stops buying bonds from financial institutions and does not reinvest the principal from the bonds it holds maturing, to purchase new bonds. It is usually positive for the value of the US Dollar.
Earnings of the week
Monday, July 24 - Domino's Pizza (DPZ), NXP Semiconductors (NXPI).
Tuesday, July 25 - Kimberly-Clark (KMB), Microsoft (MSFT), Visa (V), Texas Instruments (TXN), Verizon (VZ), General Electric (GE), Alphabet (GOOG), and General Motors (GM).
Wednesday, July 26 - Meta Platforms (META), Coca-Cola (KO), Union Pacific (UNP), Boeing (BA), AT&T (T), Chipotle (CMG)
Thursday, July 27 - Mastercard (MA), AbbVie (ABBV), McDonald's (MCD), Comcast (CMCSA), Ford Motor (F), Intel (INTC), Bristol Myers Squibb (BMY).
Friday, July 28 - Exxon Mobil (XOM), Procter & Gamble (PG), Chevron (CVX).
What they said about the market – Michael Gapen
Bank of America economist Michael Gapen said he is fairly certain of a 25 bps rate hike on Wednesday and is more focused on guidance for the rest of the year.
"The cooling of the economy is only happening slowly, and we think most [FOMC] members believe further rebalancing of supply and demand is needed to ensure disinflation will continue."
S&P 500 forecast: Evening star pattern hints bearish swing?
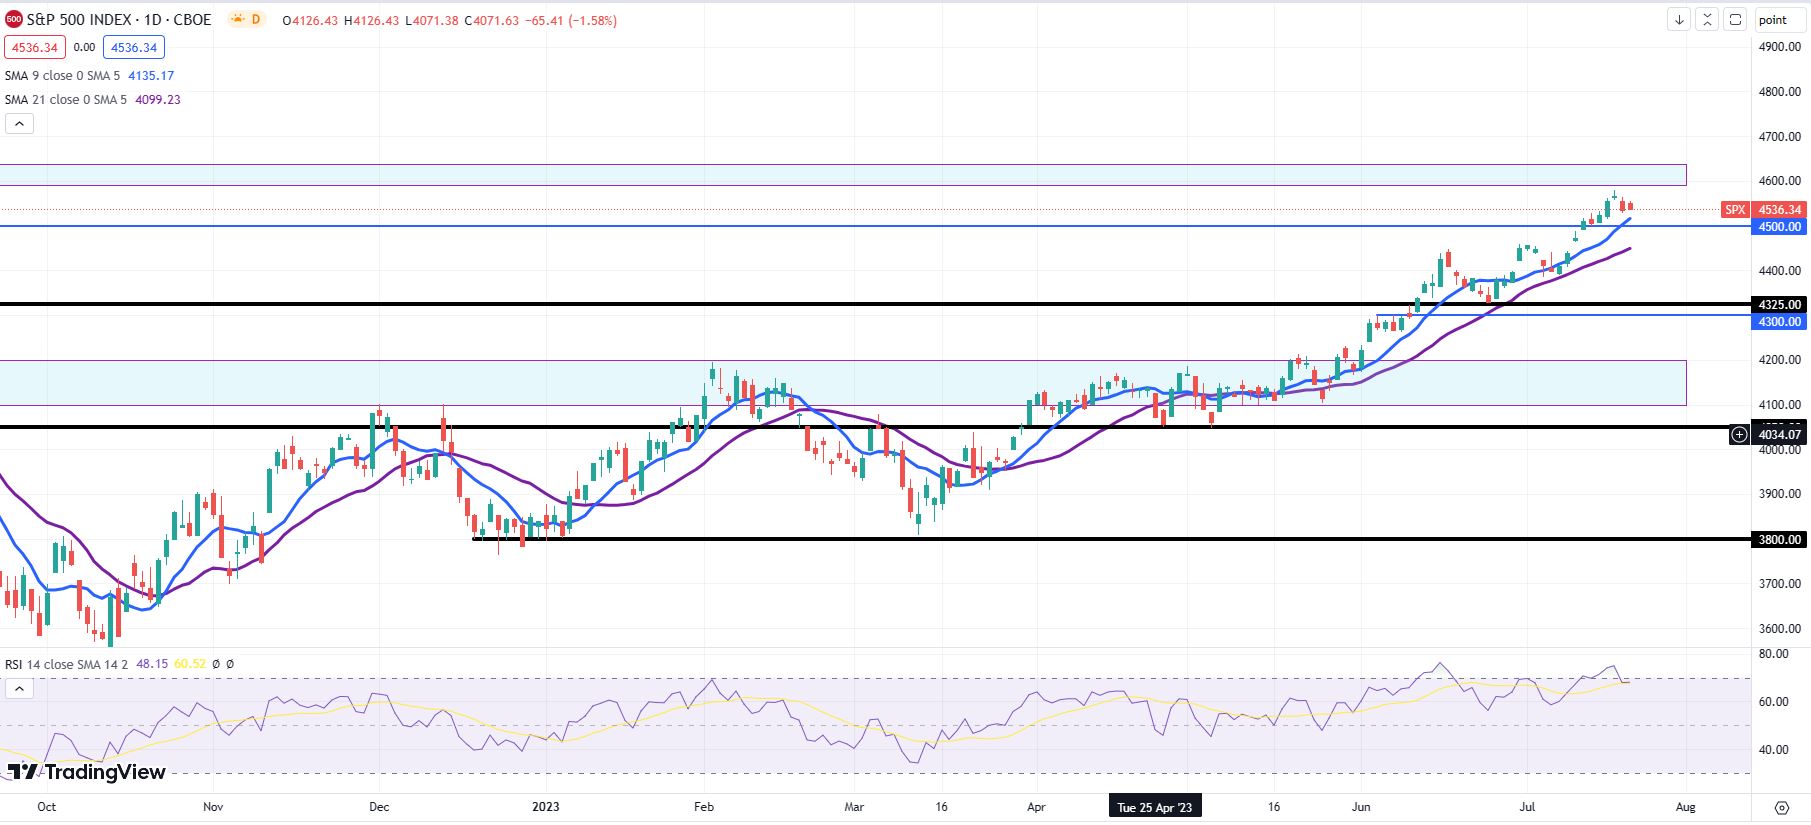
The S&P 500 closed above 4,536 last Friday. That was just a hair below the 4,590 to 4,637 resistance zone. That zone of resistance comes from February and March of 2022 when the index was experiencing a bear market rally that failed to pan out.
The Relative Strength Index (RSI) is back at 68 on the daily chart, which shows there is still room for upside but not too much. A major rally this week would be surprising, based on this indicator, but a good time to sell would be in the area just north of 4,600. This rally has been going since early March and needs a timeout.
S&P 500 daily chart
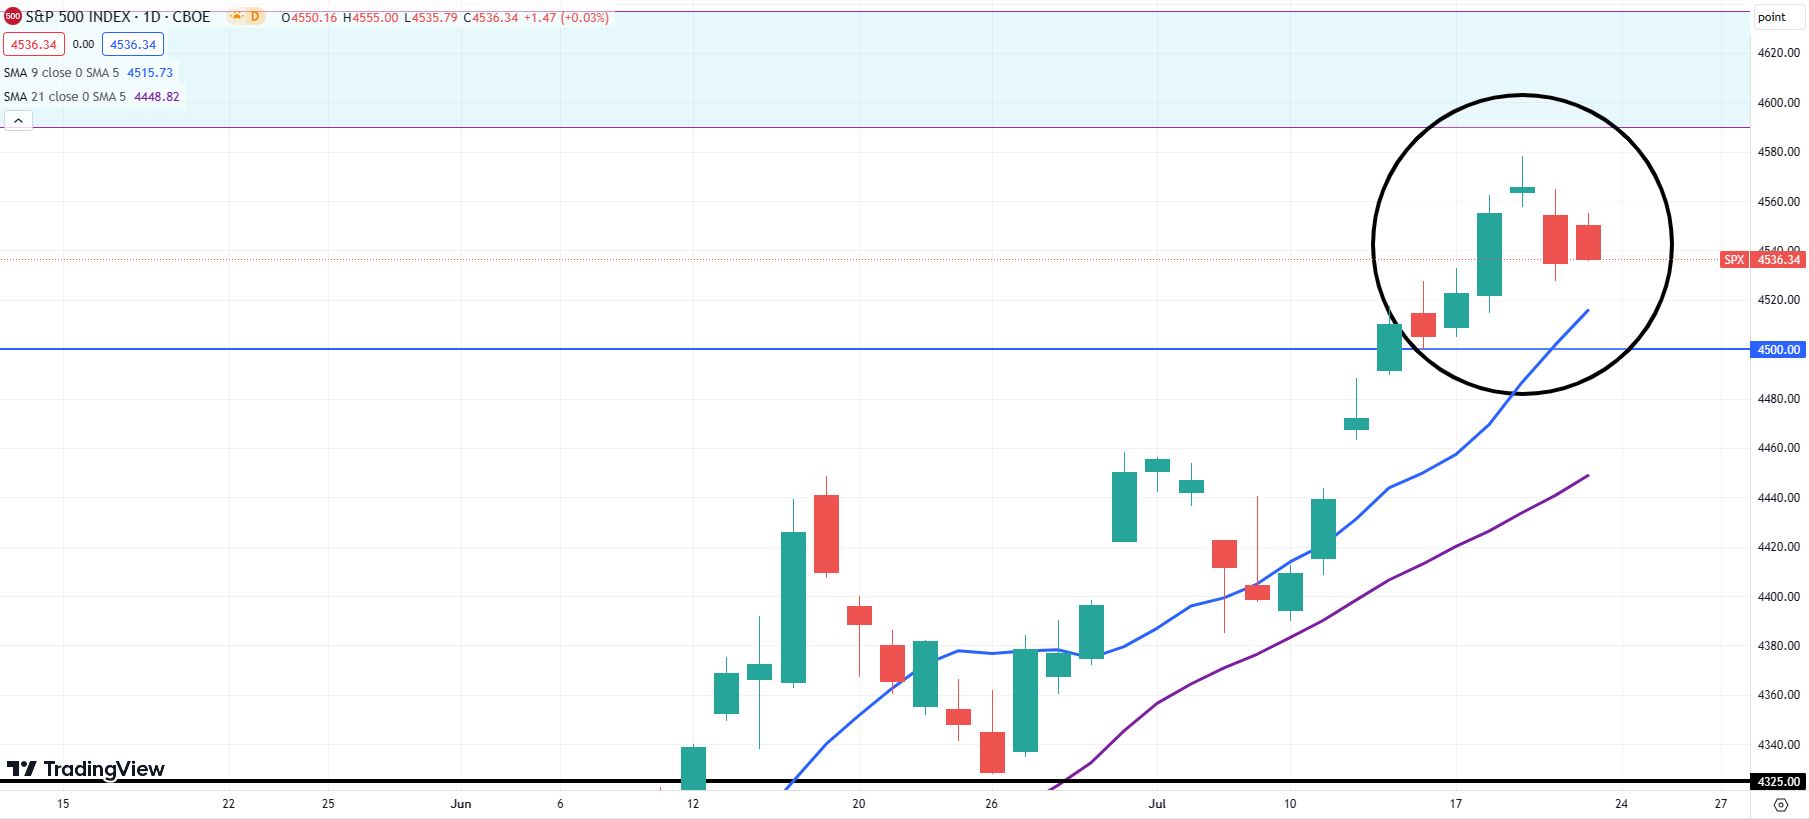
The more thought-provoking bit of drama comes from the doji created on Wednesday. Netflix (NFLX) and Tesla (TSLA) earnings disappointed enough to send the index lower off its highs on Thursday.
This doji was sandwiched between a large bullish candle on Tuesday and a bearish candle on Thursday, which makes it look like an evening star pattern. That pattern is famous for foreshadowing a bearish reversal, so it would be quite unsurprising if some faction of traders has already decided to short the index.
Support sits at 4,500 and 4,325.
Evening star pattern on S&P 500 daily chart
Premium
You have reached your limit of 3 free articles for this month.
Start your subscription and get access to all our original articles.
Author

Clay Webster
FXStreet
Clay Webster grew up in the US outside Buffalo, New York and Lancaster, Pennsylvania. He began investing after college following the 2008 financial crisis.


