S&P 500 Forecast: Big corps to announce Q3 earnings, pushing stocks higher
- S&P 500 gained 0.45% last week, its second positive week in a row, but sold off on Thursday, Friday.
- Earnings season takes center stage as Tesla, American Express, Johnson & Johnson and Goldman Sachs report.
- S&P 500 index closed Friday near support from June 26 near 4,328.
- September Retail Sales will be reported on Tuesday, Fed Chair Powell speaks on Thursday.
- Bank earnings from Wells Fargo, JPMorgan and Citigroup have raised expectations for this week’s slew of releases.

The S&P 500 index has risen 0.8% at the start of Monday trading as investors ignore higher US Treasury yields in favor of a large schedule of third-quarter results this week from some of the larger companies in the index.
The index gained 0.45% last week despite a severe sell-off on Thursday and Friday, which cut its performance in half. A spike in oil prices and US Treasuries caused by heightened worries about the Israel-Gaza hostilities led the S&P 500 closing on Friday much lower than Wednesday’s close. However, earnings on Friday from a number of the nation’s biggest banks, such as JPMorgan (JPM), Citigroup (C) and Wells Fargo (WFC), helped the Dow Jones index edge out a gain.
This week the index should likely rebound with a heavy load of major companies reporting third-quarter earnings results. While Monday has a rather light showcase, Johnson & Johnson (JNJ), Bank of America (BAC) and Goldman Sachs (GS) report on Tuesday. This will be followed by Tesla (TSLA), Morgan Stanley (MS) and Netflix (NFLX) on Wednesday. Later in the week, Union Pacific (UNP), American Express (AXP) and Taiwan Semiconductor (TSM) join the mix.
US Retail Sales for September on Tuesday will be followed by a significant speech by Federal Reserve Chair Jerome Powell on Thursday. US Treasuries are seeing their yields increase across the yield curve on Monday, particularly the longer duration bonds.
Following on from Friday’s finish, Dow Jones futures are again leading their S&P 500 and NASDAQ 100 brethren, though all three are in the green two hours before the open.
S&P 500 News: Tesla, Netflix, American Express, Taiwan Semi earnings most-watched
Based on results from large money-center banks last Friday, Bank of America’s prospects this Tuesday look to have improved. Data on Monday shows that its credit card lending business was largely stable in September as delinquencies rose a couple basis points and net charge-offs declined a similar amount.
When earnings get released early Tuesday, shareholders will want to know how Bank of America’s large portfolio of low-paying Treasury bonds is holding up. Wall Street analysts expect the bank to report earnings per share (EPS) of $0.82 on revenue of $25.07 billion. The stock is down more than 6%, however, in Monday’s premarket after closing up 8% on Friday.
Here are other consensus earnings forecasts for stocks reporting this week:
Tuesday:
- Johnson & Johnson is expected to report $2.52 in adjusted EPS on $21.06 billion in sales. Analysts were unanimous in revising their earnings forecasts lower for Q3, following the spin-off of Kenvue (KVUE).
- Goldman Sachs is expected to report $5.54 in adjusted EPS on revenue of $11.13 billion. Analysts are largely skeptical of the large investment bank this quarter.
- Lockheed Martin (LMT) is expected to earn $6.62 in EPS on $16.72 billion in sales. 75% of analysts revised profit lower for the quarter.
Wednesday:
- Netflix is expected to post consensus adjusted earnings of $3.48 per share on $8.54 billion. Most analysts raised their forecasts on EPS for the quarter.
- Tesla is expected to earn $0.74 in adjusted EPS on $24.22 billion in sales. Notably, 19 of 22 analysts revised earnings lower this quarter.
- Morgan Stanley: Adjusted EPS of $1.31 on revenue of $13.22 billion. Seven of nine analysts lowered their earnings outlook for this quarter.
- Procter & Gamble (PG) is forecast to report $1.72 in adjusted EPS on revenue of $21.59 billion.
Thursday:
- Philip Morris International (PM) is expected to release earnings of $1.62 on revenue of $9.22 billion.
- Union Pacific is expected to report earnings of $2.44 on revenue of $6 billion.
- AT&T (T) is forecast to release adjusted EPS of $0.62 on sales of $30.24 billion. Analysts are mixed on the prospects for this telecom.
- CSX (CSX) is expected to report EPS of $0.43 on $3.58 billion in sales. Analysts unanimously cut their forecasts on CSC this quarter.
- Taiwan Semiconductor is expected to earn $1.17 in adjusted EPS on revenue of $16.67 billion.
Friday:
- American Express is expected to post earnings of $2.95 per share on revenue of $15.36 billion. Analysts’ earnings forecast cuts outnumber upward revisions more than two to one.
Retail sales are the only major data drop this week
US Retail Sales for September are the only significant economic indicator to be reported this week and will likely be overshadowed in market impact by company earnings. They are expected to arrive before the market open on Tuesday showing 0.3% growth from the August number. This is down from August’s 0.6% MoM figure. Retail Sales ex Autos are expected to grow at 0.2% in September compared with August’s 0.6% reading.
US Building Permits and Housing Starts for September will be released on Wednesday. Building Permits are expected to fall below the figure from August by about 90K, while Housing Starts are expected to exceed August’s reading by about 100K.
The Fed’s Waller, Williams, Bowman, Cook and Jefferson will give speeches throughout the week that precede Jerome Powell’s speech during the market on Thursday (19:00 GMT). The CME Group’s FedWatch Tool gives a 90% chance that the central bank will hold interest rates unchanged at its November 1 meeting, so any lip service to the contrary could lead equities to decline.
S&P 500 FAQs
What is the S&P 500?
The S&P 500 is a widely followed stock price index which measures the performance of 500 publicly owned companies, and is seen as a broad measure of the US stock market. Each company’s influence on the computation of the index is weighted based on market capitalization. This is calculated by multiplying the number of publicly traded shares of the company by the share price. The S&P 500 index has achieved impressive returns – $1.00 invested in 1970 would have yielded a return of almost $192.00 in 2022. The average annual return since its inception in 1957 has been 11.9%.
How are companies chosen to be included in the S&P 500?
Companies are selected by committee, unlike some other indexes where they are included based on set rules. Still, they must meet certain eligibility criteria, the most important of which is market capitalization, which must be greater than or equal to $12.7 billion. Other criteria include liquidity, domicile, public float, sector, financial viability, length of time publicly traded, and representation of the industries in the economy of the United States. The nine largest companies in the index account for 27.8% of the market capitalization of the index.
How can I trade the S&P 500?
There are a number of ways to trade the S&P 500. Most retail brokers and spread betting platforms allow traders to use Contracts for Difference (CFD) to place bets on the direction of the price. In addition, that can buy into Index, Mutual and Exchange Traded Funds (ETF) that track the price of the S&P 500. The most liquid of the ETFs is State Street Corporation’s SPY. The Chicago Mercantile Exchange (CME) offers futures contracts in the index and the Chicago Board of Options (CMOE) offers options as well as ETFs, inverse ETFs and leveraged ETFs.
What factors drive the S&P 500?
Many different factors drive the S&P 500 but mainly it is the aggregate performance of the component companies revealed in their quarterly and annual company earnings reports. US and global macroeconomic data also contributes as it impacts on investor sentiment, which if positive drives gains. The level of interest rates, set by the Federal Reserve (Fed), also influences the S&P 500 as it affects the cost of credit, on which many corporations are heavily reliant. Therefore, inflation can be a major driver as well as other metrics which impact the Fed decisions.
Earnings of the week
Monday, October 16 - Charles Schwab (SCHW)
Tuesday, October 17 - Johnson & Johnson (JNJ), Bank of America (BAC), Lockheed Martin (LMT), Goldman Sachs (GS)
Wednesday, October 18 - Tesla (TSLA), Procter & Gamble (PG), Abbott Laboratories (ABT), Netflix (NFLX), Morgan Stanley (MS)
Thursday, October 19 - Philip Morris International (PM), Union Pacific (UNP), AT&T (T), CSX (CSX), Taiwan Semiconductor Manufacturing (TSM), American Airlines Group (AAL)
Friday, October 20 - American Express (AXP), Schlumberger (SLB)
What they said about the market – Mike Wilson
Noted Morgan Stanley bear Mike Wilson, famous for calling the sell-off in stocks in 2022, sees few reasons to believe in a fourth-quarter rally for the S&P 500. Wilson notes that resistance is declining on the topside (lower highs) in the short term, while support is rising on the downside (higher lows) over the longer term.
“With all eyes fixated on S&P 500 price action around the 50- and 200-day moving averages as the key barometer for whether we will have a 4Q rally (which is a consensus view based on our dialogue), we think it's more instructive to look beneath the surface at equal weight relative performance across sectors and styles. Here, the signals are weaker and suggest key tactical support is vulnerable.”
S&P 500 forecast
The S&P 500 closed last Friday near support at 4,328 – a support level that stems from the low on June 26. A break here would send the index down to the new support level created two weeks ago (early October) between 4,216 and 4,225. This little window appears significant as it halted downward price action four sessions in a row.
Below this terrain, only the broad 4,100 to 4,200 volume zone could halt any downdraft that arrives this week.
On the upside, the 4,380s are where resistance set in last week. From that point of view, the downtrending topline that began on July 27 is the main obstacle. This week the descending line sits near 4,450.
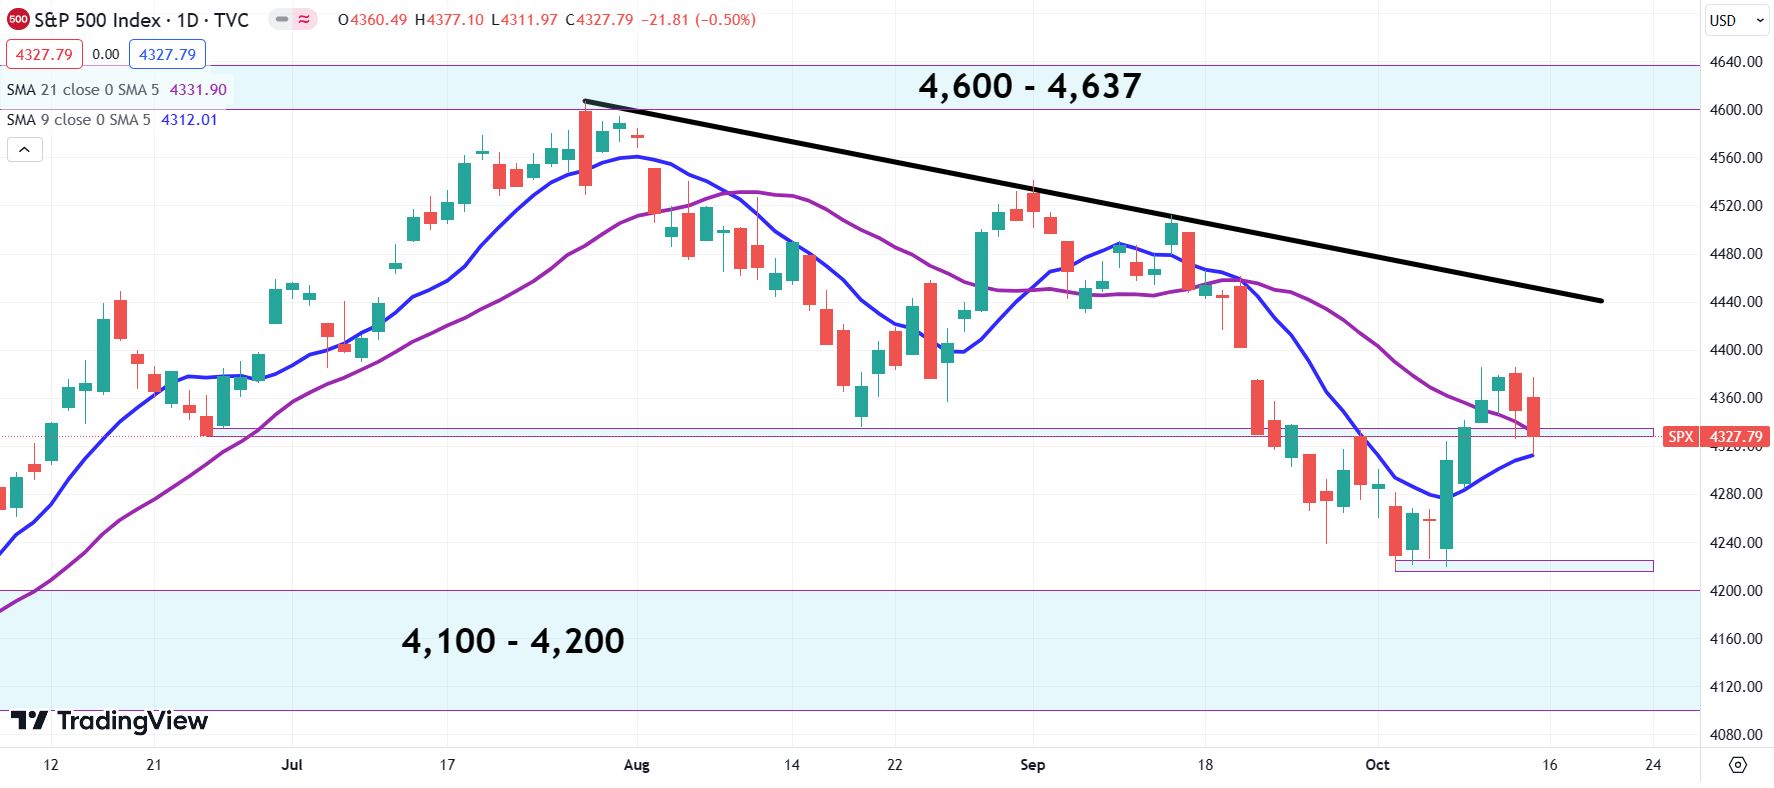
S&P 500 daily chart
Author

Clay Webster
FXStreet
Clay Webster grew up in the US outside Buffalo, New York and Lancaster, Pennsylvania. He began investing after college following the 2008 financial crisis.


