S&P 500 bears in control following break of structure amid banking sector woes
- S&P 500 index is moving into what could be a support area after breaking the structure of 4,069.
- The market will remain biased to the downside while below the 78.6% Fibonacci level and on the backside of the prior bullish trendline.
the S&P 500 dropped again on Wednesday and took out structure on the daily chart at 4,069 to print a low of 4,049.35 so far at the time of writing. The market remains offered towards the close and bears have been motivated by bank stocks which remained under pressure.
´´Support from tech stocks following Q1 earnings from Google’s parent Alphabet Inc. and Microsoft Corp. beating expectations was offset by a further 20% fall in First Republic Bank,´´ analysts at ANZ Bank explained.
First Republic Bank's shares sank more than 20%, hitting a fresh record low for the second day in a row, on a report that the US government was unwilling to engineer its rescue, after the lender reported plunging deposits earlier this week.
Analysts at ANZ bank explained that ´´the latest survey of US community banks showed that expectations of tighter regulation are now their biggest concern. If smaller banks in the US are to be regulated more tightly, that could precipitate a keener focus on bank asset quality, which amid high inflation and expected slower growth, could underpin more cautious lending behavior.´´
The analysts added that ´´it will take time to observe how behaviors are changing and the impact that can have on credit provision, but the ongoing concerns over the future of First Republic are continuing to unsettle risk.´´
Still, analysts are expecting a 3.2% contraction in first-quarter profit for S&P 500 companies compared with expectations for a 3.9% decline just a day ago, Reuters reported.
´´Of the 163 S&P 500 companies that reported first-quarter profit through Wednesday, 79.8% topped analysts' expectations, as per Refinitiv IBES data. In a typical quarter, 66% of companies beat estimates.´´
Meanwhile, the Federal Reserve's monetary policy decision on May 3 is coming up and traders will be on the lookout for clues on policymakers' next steps regarding interest rates. Traders have priced in a 79% chance of the U.S. central bank hiking rates by 25 basis points next week, as per CMEGroup's Fedwatch tool.
Elsewhere, ´´the US House of Representatives could vote as early as Wednesday on a bill that sharply cuts spending for a decade in exchange for a short-term hike in the debt ceiling, though it was unclear if it had enough support in the Republican majority to pass,´´ Reuters reported.
S&P 500 technical analysis
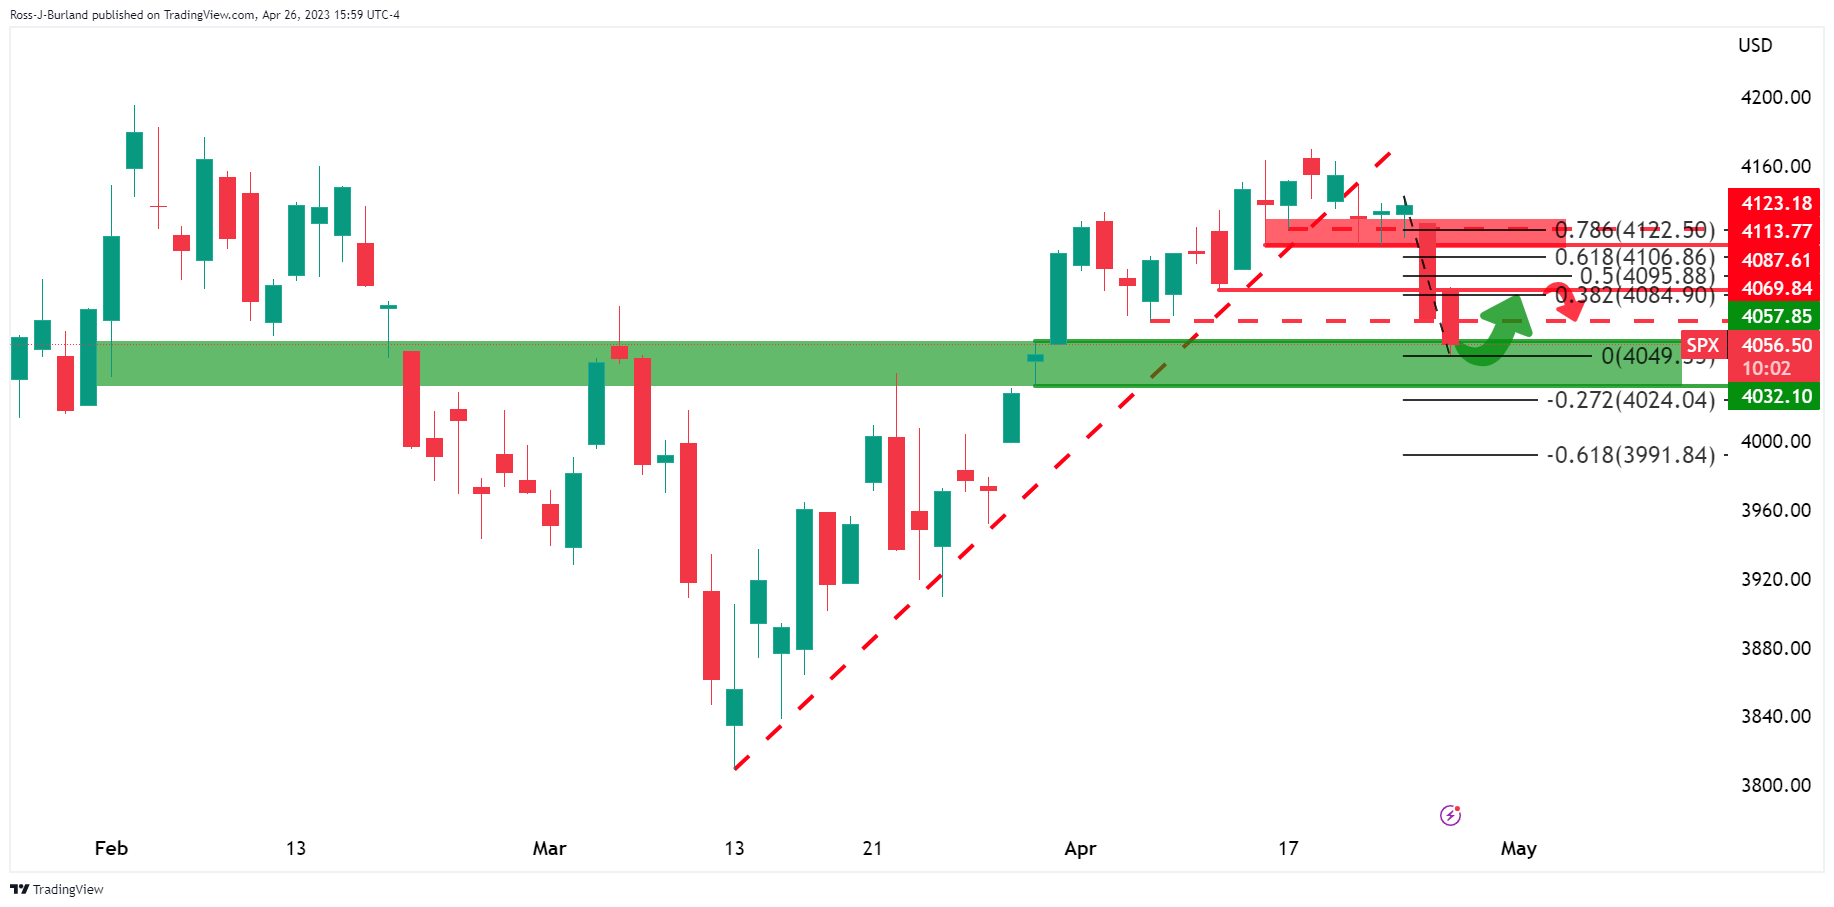
The daily chart shows the index moving into what could be a support area after breaking the structure of 4,069. A move back to 4,080s could be on the cards but the market will remain biased to the downside while below the 78.6% Fibonacci level and on the backside of the prior bullish trendline.
Author

Ross J Burland
FXStreet
Ross J Burland, born in England, UK, is a sportsman at heart. He played Rugby and Judo for his county, Kent and the South East of England Rugby team.
















