|

Silver Price Forecast: XAG/USD fluctuates amid US inflation data, Fed’s commentary

  • Silver's volatility driven by recent US CPI figures showing higher headline inflation, sparking concerns over Fed's policy path.
  • Fed officials' cautious remarks on rate cuts contribute to market uncertainty, influencing Silver's price dynamics.
  • Decline in US Treasury yields, particularly at the short end, adds pressure on the Dollar, impacting precious metal markets.

Silver price remained volatile during Thursday’s session after data from the United States (US) probed that inflation is stickier than expected, while Federal Reserve (Fed) officials commented that it’s too soon to expect a rate cut in March’s meeting. The XAG/USD exchanges hands at $22.70, down 0.77%.

Fundamentally speaking, the fall of US Treasury yields eased the pressure off Silver prices, which hit a two-month low of $22.48, before trimming its losses. Headline inflation in the US rose by 3.4% YoY exceeding forecasts for an uptick of just 3.2%. The same report revealed that core numbers dipped below 4% YoY, lower than November’s data, though they exceeded estimates.

In the meantime, some Fed officials had stressed that although progress on lowering inflation is seen, the latest reports suggest it’s becoming stickier than expected. Even though they had opened the door to ease monetary policy at some point, they remained muted about providing clues regarding the first cut.

Despite that, US Treasury yields are falling off the cliff, with the short end of the curve dropping twice the basis points compared to the belly. The US 2-year Treasury note yield is down ten basis points, at 4.26%, while the 10-year note yield sits at 3.98%, down by four basis points. This is weighing on the Greenback as the US Dollar Index (DXY) pares its earlier gains, almost flat at 102.39.

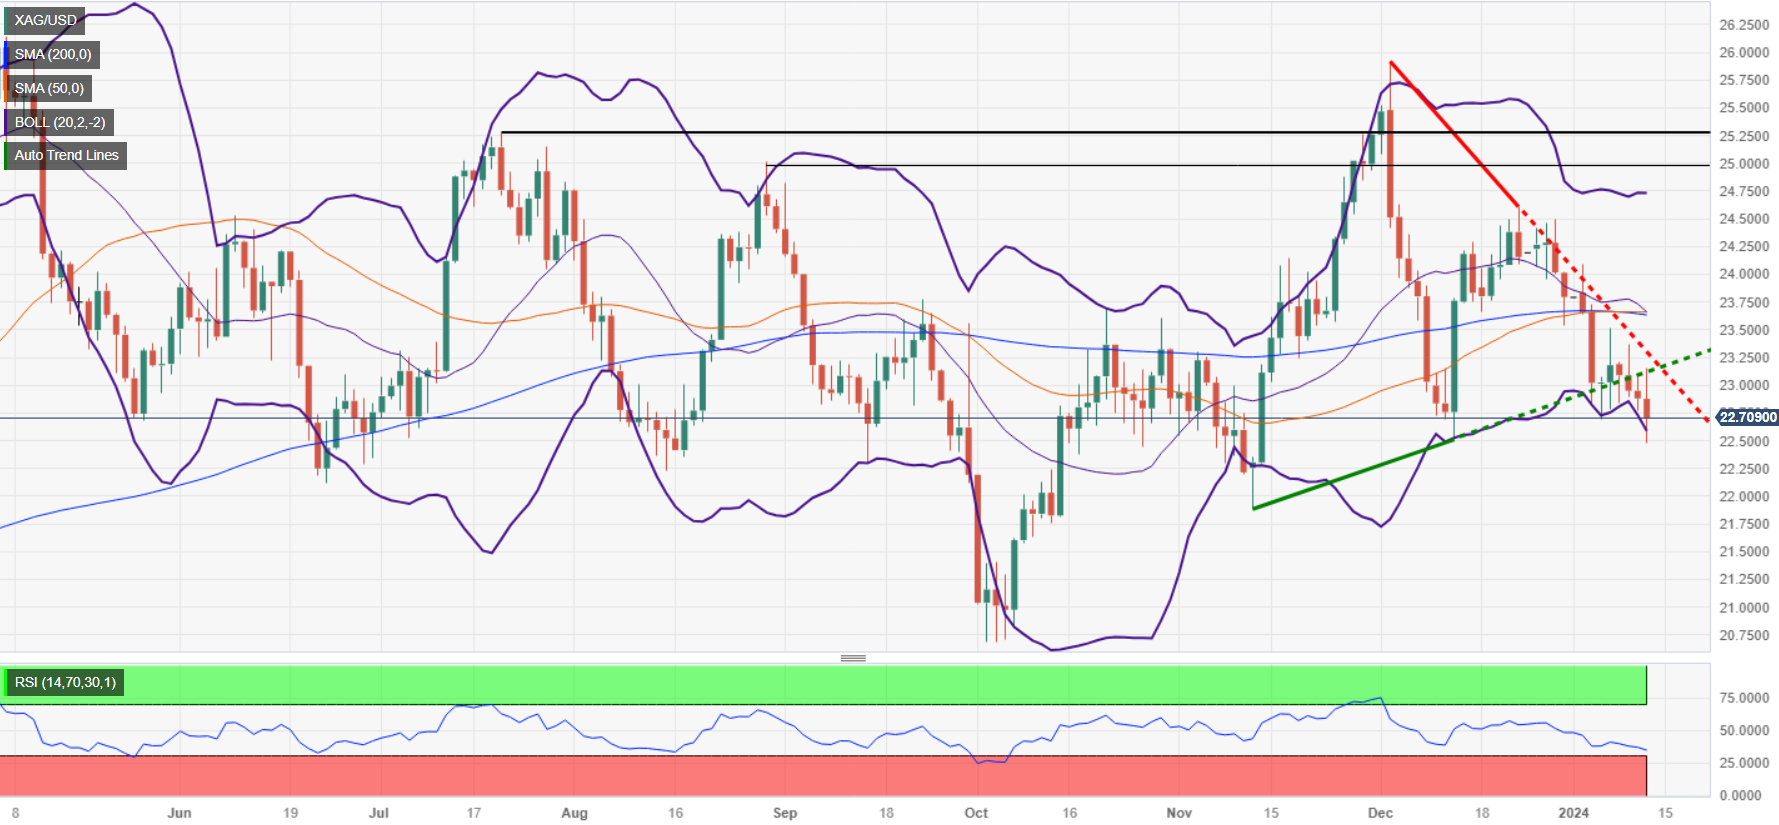
XAG/USD Price Analysis: Technical outlook

Silver’s is neutral to downward biased, though it faced solid support at around $22.51, the latest cycle low hit on December 13, with buyers stepping in and lifting the XAG/USD spot toward current levels. Nevertheless, if Silver finishes the session below $23.00, that will keep buyers pressured. XAG/USD's first support would be the January 11 low of $22.48, followed by $22.00 a troy ounce, ahead of the November 13 low of $21.88. Otherwise, if buyers reclaim $23.00, that could open the door to challenge the 100-day moving average (DMA) at around $23.26.  

XAG/USD

Overview
Today last price22.71
Today Daily Change-0.17
Today Daily Change %-0.74
Today daily open22.88
 
Trends
Daily SMA2023.73
Daily SMA5023.66
Daily SMA10023.29
Daily SMA20023.64
 
Levels
Previous Daily High23.11
Previous Daily Low22.77
Previous Weekly High24.09
Previous Weekly Low22.69
Previous Monthly High25.92
Previous Monthly Low22.51
Daily Fibonacci 38.2%22.9
Daily Fibonacci 61.8%22.98
Daily Pivot Point S122.73
Daily Pivot Point S222.59
Daily Pivot Point S322.4
Daily Pivot Point R123.07
Daily Pivot Point R223.25
Daily Pivot Point R323.4

Author

Christian Borjon Valencia

Markets analyst, news editor, and trading instructor with over 14 years of experience across FX, commodities, US equity indices, and global macro markets.

More from Christian Borjon Valencia
Share:

Editor's Picks

AUD/USD stays bid above 0.7100 on Australian trade data, Mideast optimism

AUD/USD clings to minor recovery gains above 0.7100 in the Asian session on Thursday as a new Israel-Lebanon ceasefire keeps a lid on the safe-haven US Dollar. Meanwhile, strong AustralianTrade Balane data also help the Aussie pair sustain the bounce from weekly lows.

USD/JPY hovers near the 160.00 intervention threshold on Mideast tensions

USD/JPY struggles to find acceptance above 160.00 and retreats from a one-month high in the Asian session on Thursday amid fears that authorities will step in again to prop up the Japanese Yen. Furthermore, a new Israel-Lebanon ceasefire caps the US Dollar and supports the currency pair. However, renewed US-Iran tensions keep the downside limited in the Greenback and the pair.

Gold defends 200-day SMA; upside seems capped on Iran uncertainty

Gold recovers from a one-week low near $4,425, or the 200-day SMA, in the Asian session on Thursday, as news of an Israel-Lebanon ceasefire acts as a headwind for the safe-haven US Dollar. However, renewed hostilities in the Gulf, along with stalled US-Iran peace talks, keep geopolitical risks in play and should support the USD, checking the Gold price rebound.


Ethereum: Long-term holders' capitulation drives ETH below $1,800

Ethereum has fallen below $1,800 on Wednesday, the first time since May 2025 following accelerated spot selling pressure and distributions from long-term holders. The Age Consumed metric, which tracks the movement of previously idle tokens or long-term holders' coins, spiked over the past two days as prices declined, indicating increased selling activity among this cohort.

Kevin Warsh takes the Fed helm: What it means for the US Dollar
The Federal Reserve moves away from the highly predictable "forward guidance" model of the Jerome Powell era to a new “Kevin Warsh environment”, characterized by less communication, more policy surprises, and an increased focus on the Fed's complex balance sheet.
Recession on paper: What really moves the Canadian Loonie now?

Statistics Canada handed the headline writers a gift and the analysts a headache. Real GDP shrank 0.1% on an annualized basis in the first quarter, and with the fourth quarter of 2025 revised down to a 1.0% contraction, that is two negative quarters in a row, the textbook definition of a technical recession and Canada's first since the pandemic.