Silver Price Forecast: XAG/USD dips as US bond yields rise, US NFP data exceed forecasts
- Silver price pulls back as robust US jobs report strengthens Treasury bond yields.
- Expectations for a July rate hike by the Fed mount, pressuring precious metals.
- Resolution of US debt-ceiling drama provides potential respite for Silver.

Silver price makes a U-turn following the path of Gold, as precious metals weighed by high US Treasury bond yields edge lower. XAG/USD opened around the daily highs and printed a weekly high of $24.00 before retreating past the 50- and 20-day Exponential Moving Averages (EMAs) confluence at the time of writing. XAG/USD is trading at $23.61, down 0.01%.
XAG/USD retreats amid strong US jobs data and anticipation of Fed rate hike
XAG/USD slid on a hotter-than-expected US Nonfarm Payrolls report in May, which revealed that 339K Americans entered the workforce, more than one and a half expected of 190K. The headline data suggests the Federal Reserve (Fed) still has some work. Still, the Unemployment Rate saw signs of upward pressure, from 3.4% to 3.7% YoY, while Average Hourly Earnings, seen as wages inflation, stood at 4.3% YoY, a tick lower than April’s.
Given the amount of data revealed, traders brace for a July rate hike by the Fed, aligning themselves with recent Fed officials’ commentary, led by the Chair Jerome Powell, saying the US central bank could skip a meeting to see the effects of 500 bps of tightening. Vice-Chair nominee Philip Jefferson and the Philadelphia Fed President Patrick Harker reinforced the message.
Therefore US Treasury bond yields exploded to the upside, a headwind for the precious metals segment. US Treasury bond yields climbed, with 2s up 16 bps to 4.501%, while 10s stand at 3.689%, gaining nine bps. The US Dollar Index (DXY), which tracks the greenback’s value against a basket of six currencies, rose 0.46%, up at 104.041, but set to finish the week on the wrong foot.
On the geopolitical sphere, the US debt-ceiling saga finished with a happy ending, with both chambers, the US House and the Senate passing the bill, easing fears of a possible US government default. The bill would be signed into law by US President Joe Biden over the weekend.
XAG/USD Price Analysis: Technical outlook
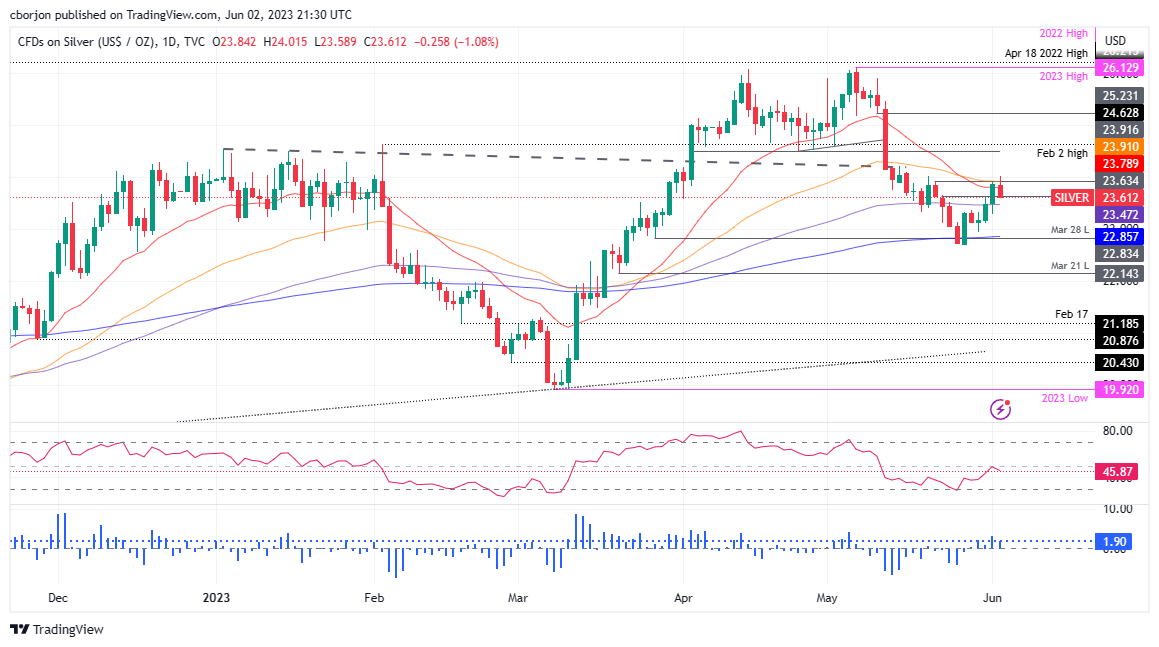
Given the fundamental backdrop, the XAG/USD shifted from neutral upward biased to neutral. The Relative Strength Index (RSI) indicator dodged the 50-midline and aimed downwards, suggesting that sellers are still in place. But the 3-day Rate of Change (RoC) indicates that selling pressure is beginning to fade. It means the white metal could remain sideways, awaiting the next catalyst.
Upwards, resistance levels lie at the 20-day EMA at $23.79, the 50-day EMA at $23.91, and the $24.00 figure. Conversely, XAG/USD support levels are the 100-day EMA at $23.47, the $23.00 psychological price level, and the 200-day EMA At $22.85.
Author

Christian Borjon Valencia
FXStreet
Markets analyst, news editor, and trading instructor with over 14 years of experience across FX, commodities, US equity indices, and global macro markets.


