Silver Price Forecast: XAG/USD consolidates below $32.00 mark, bullish bias remains
- Silver fails to build on the overnight modest rebound from the vicinity of mid-$31.00s.
- The technical setup supports prospects for an extension of the recent upward trajectory.
- Any meaningful decline might still be seen as a buying opportunity and remain limited.

Silver (XAG/USD) struggles to gain any meaningful traction and oscillates in a narrow trading band, around the $31.80-$31.85 region during the Asian session on Thursday. The white metal, meanwhile, remains within the striking distance of a four-month peak touched on Wednesday and seems poised to prolong the upward trajectory witnessed over the past two weeks or so.
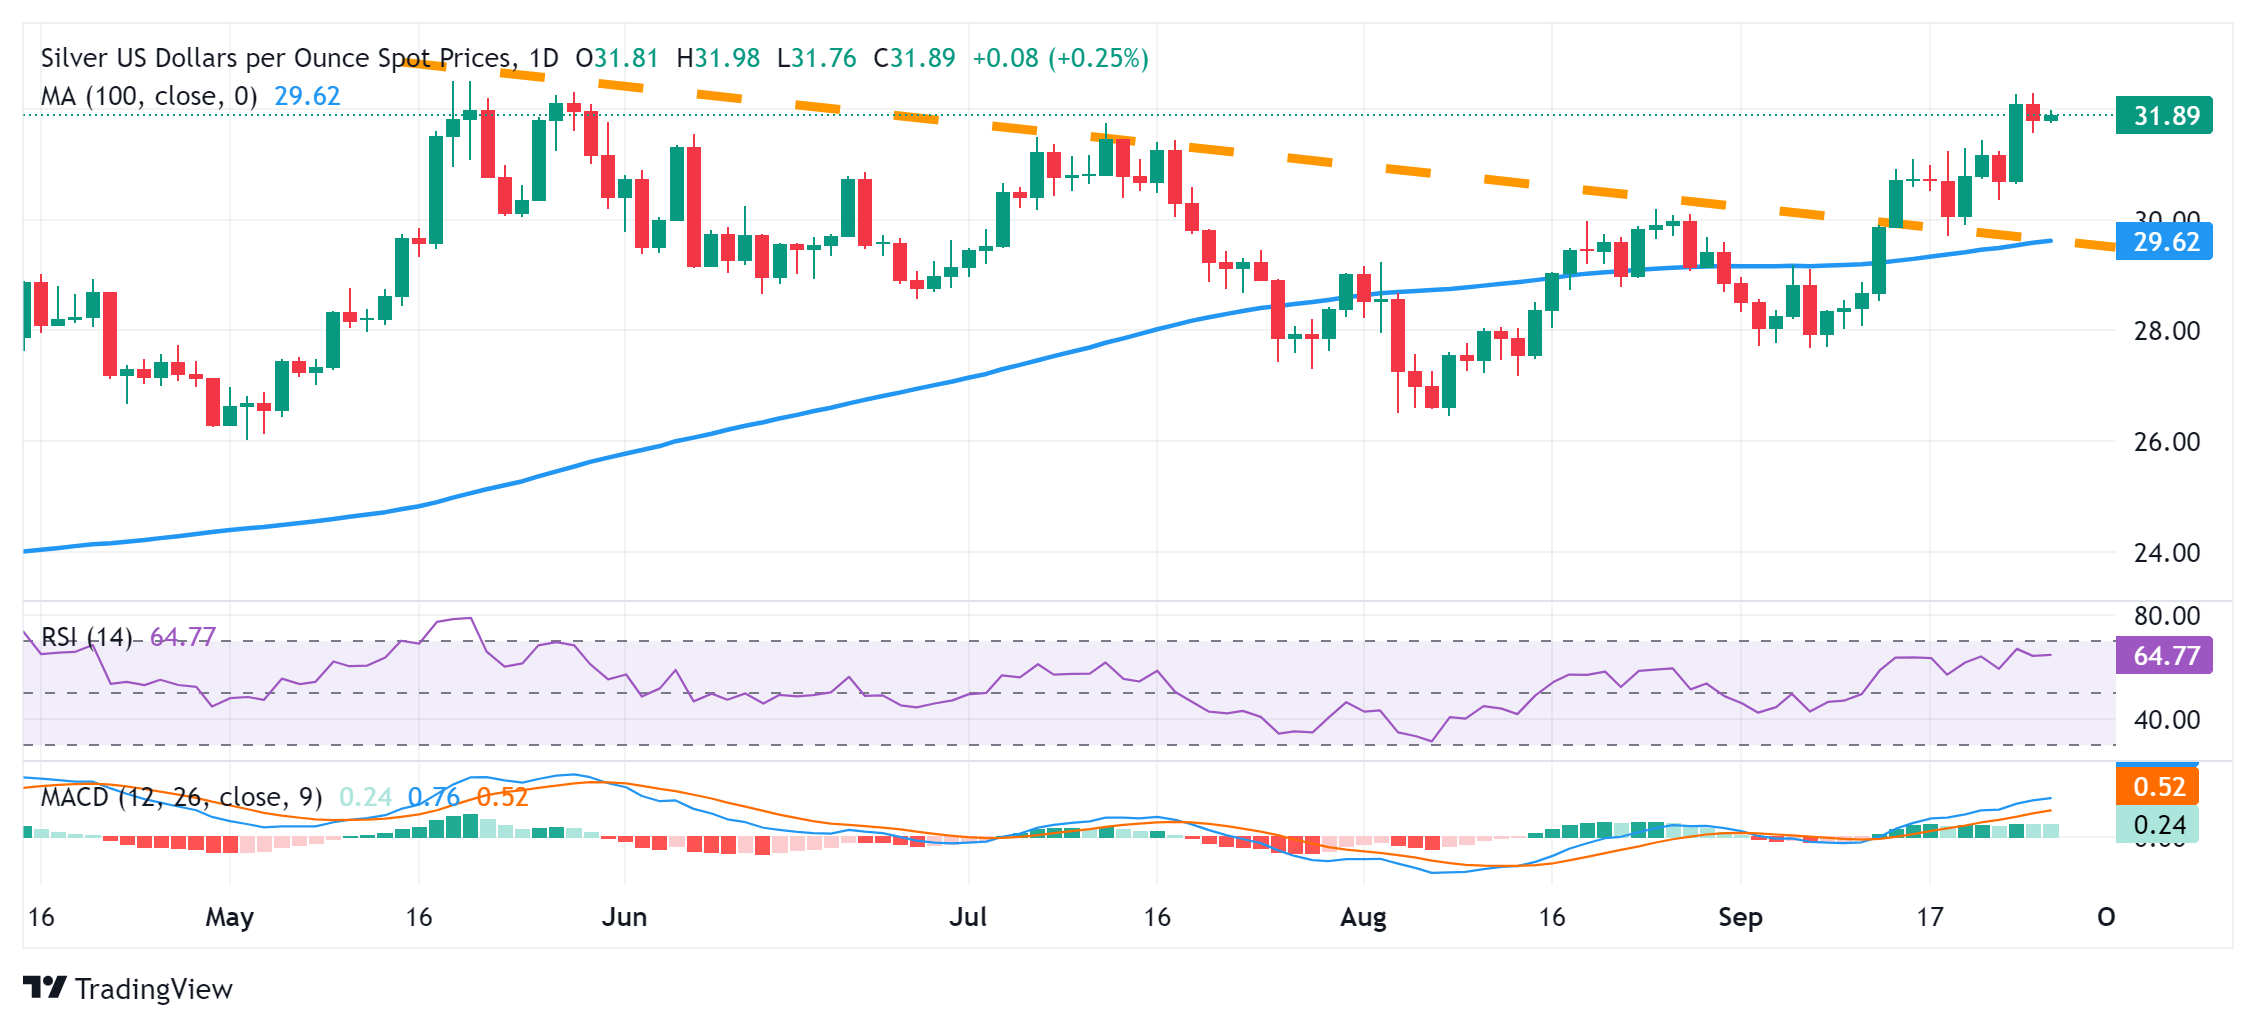
From a technical perspective, the overnight sustained strength beyond the $31.40-$31.45 supply zone comes on the back of the recent breakout through a short-term descending trend-line resistance. This, along with the fact that oscillators on the daily chart are holding comfortably in positive territory and are still away from being in the overbought zone, validates the positive outlook and suggests that the path of least resistance for the XAG/USD is to the upside.
Hence, a subsequent move beyond the $32.00 mark, towards retesting a one-decade top, around mid-$32.00s touched in May, looks like a distinct possibility. Some follow-through buying should pave the way for a further appreciating move towards conquering the $33.00 round-figure mark for the first time since December 2012.
On the flip side, weakness below the overnight swing low, around the $31.60-$31.55 region, is likely to find some support near the $31.25 area ahead of the $31.00 mark. A convincing break below the latter could drag the XAG/USD to the $30.60-$30.55 zone. The downfall could extend further towards the $30.00 psychological mark before the white metal drops to the $29.70-$29.65 area, or the descending trend-line resistance breakpoint, now turned support.
The latter now coincides with the 100-day Simple Moving Average (SMA) and should act as a key pivotal point, which if broken decisively will suggest that the XAG/USD has topped out in the near term and pave the way for a deeper corrective decline.
Silver daily chart
Silver FAQs
Silver is a precious metal highly traded among investors. It has been historically used as a store of value and a medium of exchange. Although less popular than Gold, traders may turn to Silver to diversify their investment portfolio, for its intrinsic value or as a potential hedge during high-inflation periods. Investors can buy physical Silver, in coins or in bars, or trade it through vehicles such as Exchange Traded Funds, which track its price on international markets.
Silver prices can move due to a wide range of factors. Geopolitical instability or fears of a deep recession can make Silver price escalate due to its safe-haven status, although to a lesser extent than Gold's. As a yieldless asset, Silver tends to rise with lower interest rates. Its moves also depend on how the US Dollar (USD) behaves as the asset is priced in dollars (XAG/USD). A strong Dollar tends to keep the price of Silver at bay, whereas a weaker Dollar is likely to propel prices up. Other factors such as investment demand, mining supply – Silver is much more abundant than Gold – and recycling rates can also affect prices.
Silver is widely used in industry, particularly in sectors such as electronics or solar energy, as it has one of the highest electric conductivity of all metals – more than Copper and Gold. A surge in demand can increase prices, while a decline tends to lower them. Dynamics in the US, Chinese and Indian economies can also contribute to price swings: for the US and particularly China, their big industrial sectors use Silver in various processes; in India, consumers’ demand for the precious metal for jewellery also plays a key role in setting prices.
Silver prices tend to follow Gold's moves. When Gold prices rise, Silver typically follows suit, as their status as safe-haven assets is similar. The Gold/Silver ratio, which shows the number of ounces of Silver needed to equal the value of one ounce of Gold, may help to determine the relative valuation between both metals. Some investors may consider a high ratio as an indicator that Silver is undervalued, or Gold is overvalued. On the contrary, a low ratio might suggest that Gold is undervalued relative to Silver.
Author

Haresh Menghani
FXStreet
Haresh Menghani is a detail-oriented professional with 10+ years of extensive experience in analysing the global financial markets.


