|

Silver Price Analysis: XAG/USD tides could be turning despite NFP

  • Silber bears are moving in as an hourly lower low is put in and a lower high on Friday.
  • The weekly and daily charts also lean bearish and readers look for confirmation of a trend change. 

Silver rose on Friday and was on track for their first weekly gain in four as the Greenback and US treasury bond yields fell after weaker US Nonfarm Payrolls numbers cast doubts over the Federal Reserve's interest rate hiking path beyond July yet again. November Fed hike odds dropped to 39% from 45% after Nonfarm Payrolls.

At the time of writing, XAG/USD is trading at $23.1038 and has travelled between a low of $22.6165 and a high of $23.1545. The following technical analysis arrived at a bearish thesis, however, for the medium and longer-term:

Silver Weekly charts

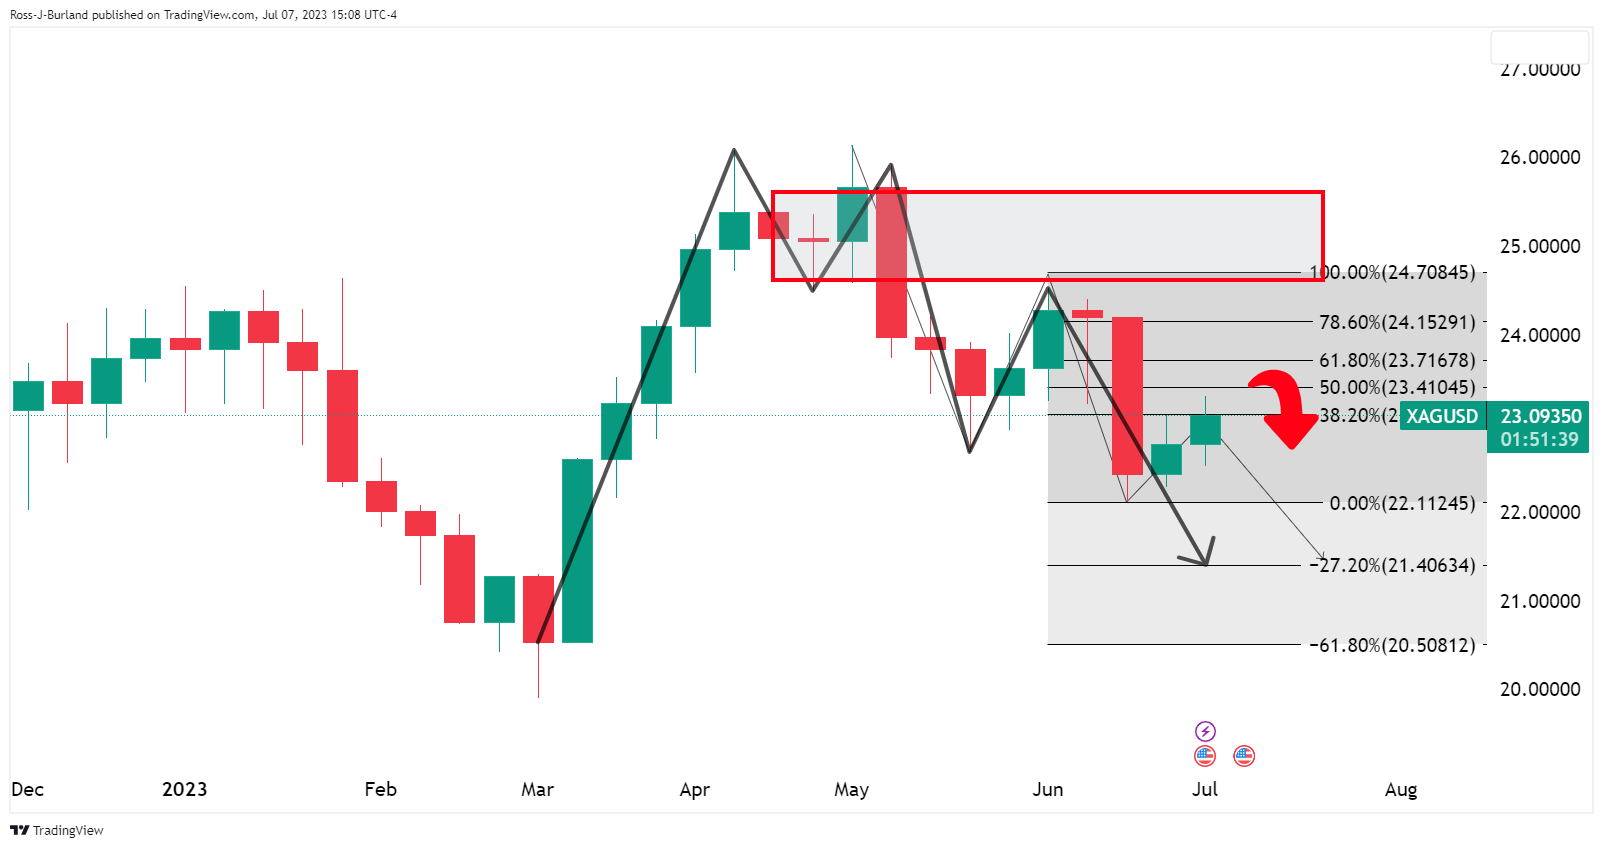
The weekly chart shows the price edging up to test the bearish commitments near the neckline of the M-formation in a 38.2% Fibonacci retracement. While the corrections not showing signs of deceleration, this can be monitored on the lower time frames for clues. 

Silver Daily chart

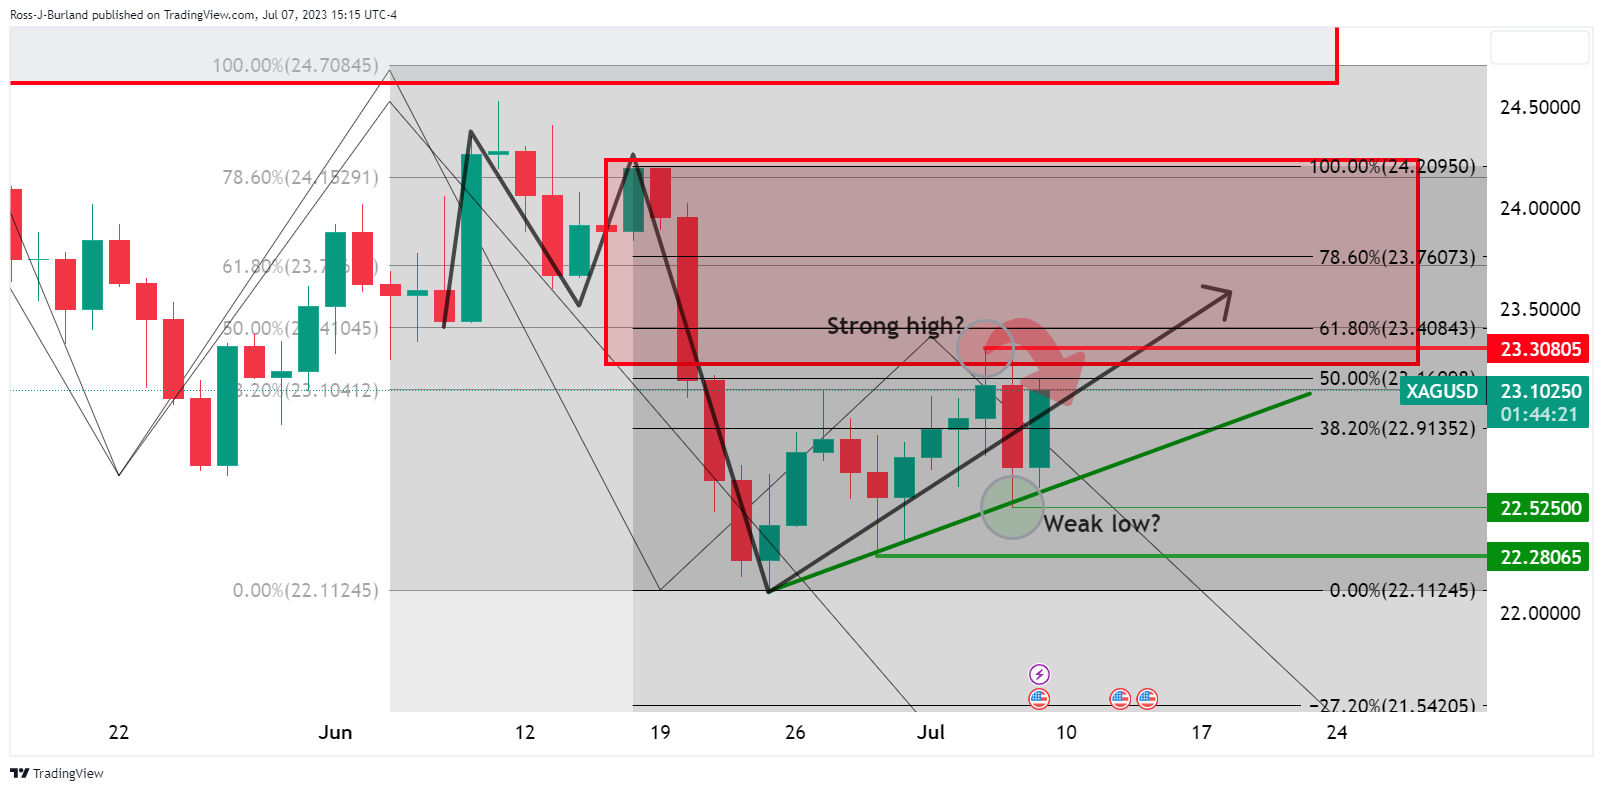
The daily chart is showing the price is moving to a near 61.8% Fibonacci retracement and into the M-formation neckline resistance. A strong high may have been put in already. 

Silver H1

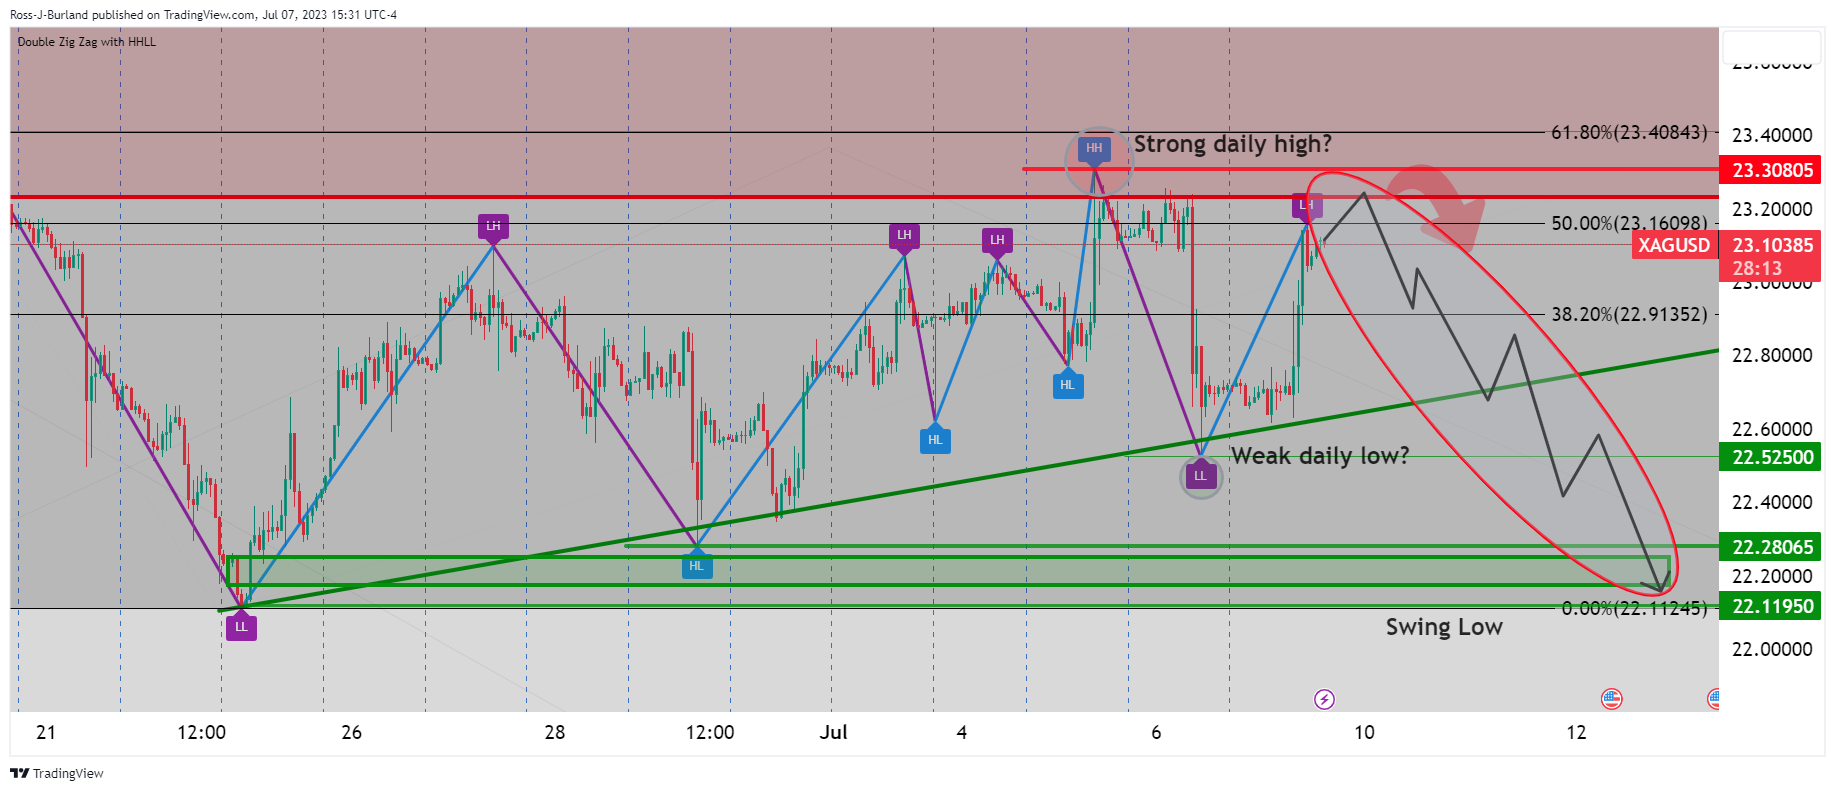
On the hourly time frame, a lower low was recently put in and this could be a sign that the bulls are tiring. A lower high could result in a sell-off and a target is eyed to the swing lows as a potential demand area. 

Author

Ross J Burland

Ross J Burland, born in England, UK, is a sportsman at heart. He played Rugby and Judo for his county, Kent and the South East of England Rugby team.

More from Ross J Burland
Share:

Markets move fast. We move first.

Orange Juice Newsletter brings you expert driven insights - not headlines. Every day on your inbox.

By subscribing you agree to our Terms and conditions.

Editor's Picks

EUR/USD flatlines below 1.1800 amid trading lull, awaits Fed Minutes

EUR/USD trades around a flatline below 1.1800 in European trading on Tuesday. The pair lacks any trading impetus as the US Dollar moves little amid market caution ahead of the Fed's December Meeting Minutes release, which could offer insights into the Federal Reserve’s 2026 outlook.

GBP/USD retakes 1.3500 despite the year-end grind

GBP/USD finds fresh demand and retakes 1.3500 on Tuesday as markets grind through the last trading week of the year. Despite the latest uptick, the pair is unlikely to see further progress due to the year-end holiday volumes.

Gold holds the bounce on Fed rate cut bets, safe-haven flows

Gold holds the rebound near $4,350 in the European trading hours on Tuesday. The precious metal recovers some lost ground after falling 4.5% in the previous session, which was Gold's largest single-day loss since October. Increased margin requirements on gold and silver futures by the Chicago Mercantile Exchange Group, one of the world’s largest trading floors for commodities, prompted widespread profit-taking and portfolio rebalancing.

Tron steadies as Justin Sun invests $18 million in Tron Inc.

Tron (TRX) trades above $0.2800 at press time on Monday, hovering below the 50-day Exponential Moving Average (EMA) at $0.2859.

Economic outlook 2026-2027 in advanced countries: Solidity test

After a year marked by global economic resilience and ending on a note of optimism, 2026 looks promising and could be a year of solid economic performance. In our baseline scenario, we expect most of the supportive factors at work in 2025 to continue to play a role in 2026.

Crypto market outlook for 2026

Year 2025 was volatile, as crypto often is.  Among positive catalysts were favourable regulatory changes in the U.S., rise of Digital Asset Treasuries (DAT), adoption of AI and tokenization of Real-World-Assets (RWA).