|

Silver Price Analysis: XAG/USD sellers attack 100-week SMA on the way to $22.00

  • Silver prints three-day downtrend near yearly low, recently off multi-day low.
  • Bearish MACD signals further downside but Momentum seems to dwindle of late.
  • Corrective pullback needs to regain $23.00 to recall the buyers, key Fibonacci retracement and 200-week SMA lure bears.

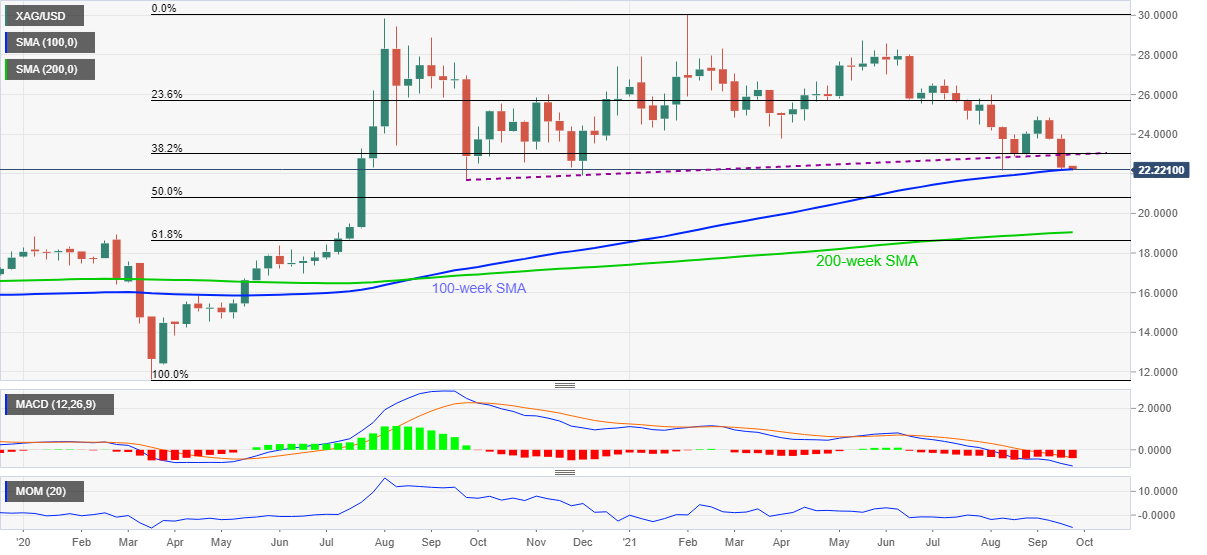
Silver (XAG/USD) sellers tease the yearly low surrounding $22.15-20 amid the initial Asian session on Monday. In doing so, the white metal battles with the 100-week SMA amid bearish MACD signals and a weaker Momentum line.

Although the strong SMA and less-favorable Momentum for further downside challenge the silver bears, the rebound needs to cross the support-turned-resistance line from September 2020, around $23.00, to convince buyers.

Even so, April’s low around $23.80 and the monthly peak near $24.85 adds to the upside filters.

Meanwhile, a clear break of the $22.23 SMA level will direct the CAG/USD prices towards 50% Fibonacci retracement of March 2020 to February 2021 upside, near $20.82.

In a case where the silver sellers keep reins past $20.82, the $20.00 threshold and 200-week SMA near $19.00 will challenge them afterward.

Silver: Weekly chart

Trend: Short-covering move expected

Additional important levels

Overview
Today last price22.32
Today Daily Change-0.08
Today Daily Change %-0.36%
Today daily open22.4
 
Trends
Daily SMA2023.85
Daily SMA5024.4
Daily SMA10025.73
Daily SMA20025.87
 
Levels
Previous Daily High23.14
Previous Daily Low22.33
Previous Weekly High23.97
Previous Weekly Low22.33
Previous Monthly High26
Previous Monthly Low22.17
Daily Fibonacci 38.2%22.64
Daily Fibonacci 61.8%22.83
Daily Pivot Point S122.11
Daily Pivot Point S221.82
Daily Pivot Point S321.31
Daily Pivot Point R122.92
Daily Pivot Point R223.43
Daily Pivot Point R323.72

Author

Anil Panchal

Anil Panchal

FXStreet

Anil Panchal has nearly 15 years of experience in tracking financial markets. With a keen interest in macroeconomics, Anil aptly tracks global news/updates and stays well-informed about the global financial moves and their implications.

More from Anil Panchal
Share:

Editor's Picks

EUR/USD remains offered below 1.1600, seems vulnerable near multi-month low

The EUR/USD pair struggles to capitalize on the overnight bounce from the 1.1530 region, or the lowest level since November 2025, and lower for the third consecutive day on Wednesday. Spot prices slide back below the 1.1600 mark during the Asian session and seem vulnerable to slide further.

GBP/USD slips below key averages as geopolitical risks mount

GBP/USD fell about 0.35% on Tuesday, settling around 1.3350 after slipping below the 200-day Exponential Moving Average for the first time since early December. The pair has pulled back sharply from its late-January high near 1.3870, shedding over 500 pips in a series of lower highs and lower lows. 

Gold rebounds ahead of US ADP, will it last?

Gold finds renewed Asian bids and retests $5,230 early Wednesday after the heavy sell-off on Tuesday. The US Dollar stands tall amid escalating Middle East tensions and reduced dovish Fed expectations. Gold defends $5,000 or 50% Fibo level after facing rejection at the 78.6% Fibo resistance at $5,342 amid bullish RSI.  

Ethereum: Whales step up buying as short positions contract

After holding firm heading into the last weekend, Ethereum whales have returned to action, pouncing on the volatility stemming from escalating military actions between the US and Iran.

Energy shock 2.0: Why rising Gas prices could hit the Euro

Even without a confirmed, sustained disruption, the mere risk to a key global energy chokepoint is enough to inject a significant premium into European Gas markets. And for the Euro, that matters.

Ripple falters amid sell-off jitters and negative funding rates

Ripple (XRP) has come under pressure, drifting lower to $1.35 at the time of writing on Tuesday. The over 2% correction looks poised to erase the previous day’s gains, which lifted the remittance token to $1.42.