Silver Price Analysis: XAG/USD retreats from key EMA hurdles below $24.00


  • Silver Price fades late Monday’s recovery as 21-EMA, 50-EMA prod bulls.
  • MACD, RSI (14) line suggest further grinding towards the north.
  • Three-month-old ascending trend line, 200-EMA restrict short-term downside.

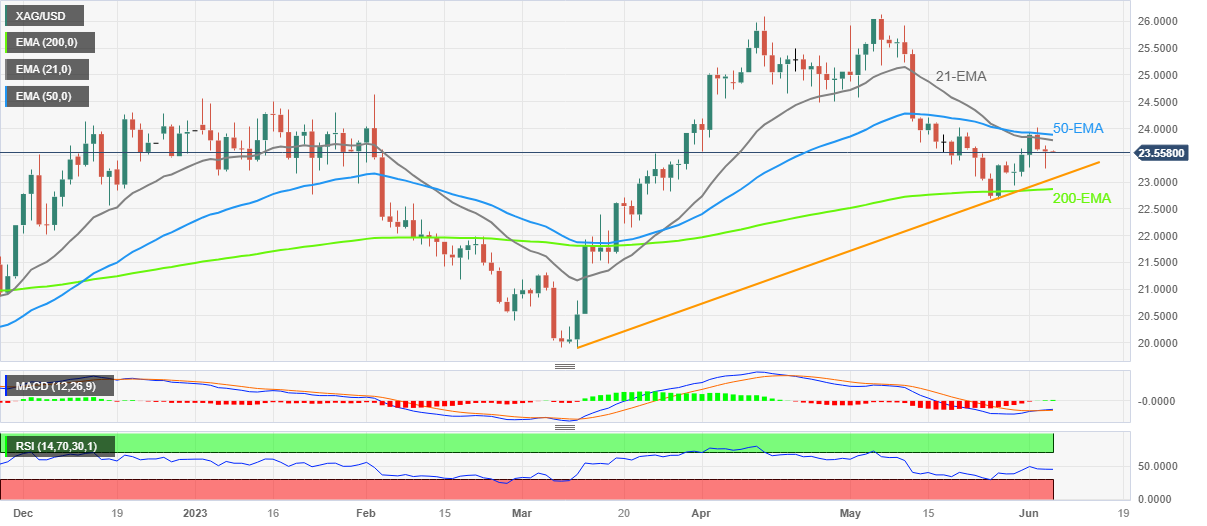
Silver Price (XAU/USD) remains depressed near $23.55, fading the previous day’s corrective bounce off $23.25, amid early Tuesday.

In doing so, the bright metal registers a failure to cross the 21-day and 50-day Exponential Moving Averages (EMAs). However, the quote’s previous rebound from an upward-sloping support line from early March, as well as the 200-EMA, keeps the XAG/USD bears off the table.

That said, the bullish MACD signals and upbeat RSI (14) also suggest further grinding of the Silver Price towards the north.

With this, the Silver traders can expect a short-term downside towards the aforementioned three-month-old upward-sloping support line, close to $23.05, quickly followed by the $23.00 round figure. However, the 200-EMA level of around $22.85 can challenge the XAG/USD bears afterward.

In a case where the XAG/USD drops below $22.85, the previous monthly low of $22.70 appears the last defense of the Silver buyers.

On the contrary, the 21-EMA and 50-EMA restrict short-term upside of the Silver Price near $23.80 and $23.90 in that order.

Following that, the $24.00 round figure holds the key for the metal’s further upside towards late April’s swing low of around $24.50 and then toward the February month’s high of near $24.65.

Silver Price: Daily chart

Trend: Recovery expected

Additional important levels

Overview
Today last price 23.56
Today Daily Change -0.01
Today Daily Change % -0.04%
Today daily open 23.57
 
Trends
Daily SMA20 23.76
Daily SMA50 24.46
Daily SMA100 23.35
Daily SMA200 22.15
 
Levels
Previous Daily High 23.69
Previous Daily Low 23.25
Previous Weekly High 24.02
Previous Weekly Low 22.93
Previous Monthly High 26.14
Previous Monthly Low 22.68
Daily Fibonacci 38.2% 23.42
Daily Fibonacci 61.8% 23.52
Daily Pivot Point S1 23.32
Daily Pivot Point S2 23.06
Daily Pivot Point S3 22.88
Daily Pivot Point R1 23.76
Daily Pivot Point R2 23.94
Daily Pivot Point R3 24.2


Share: Feed news

Information on these pages contains forward-looking statements that involve risks and uncertainties. Markets and instruments profiled on this page are for informational purposes only and should not in any way come across as a recommendation to buy or sell in these assets. You should do your own thorough research before making any investment decisions. FXStreet does not in any way guarantee that this information is free from mistakes, errors, or material misstatements. It also does not guarantee that this information is of a timely nature. Investing in Open Markets involves a great deal of risk, including the loss of all or a portion of your investment, as well as emotional distress. All risks, losses and costs associated with investing, including total loss of principal, are your responsibility. The views and opinions expressed in this article are those of the authors and do not necessarily reflect the official policy or position of FXStreet nor its advertisers. The author will not be held responsible for information that is found at the end of links posted on this page.

If not otherwise explicitly mentioned in the body of the article, at the time of writing, the author has no position in any stock mentioned in this article and no business relationship with any company mentioned. The author has not received compensation for writing this article, other than from FXStreet.

FXStreet and the author do not provide personalized recommendations. The author makes no representations as to the accuracy, completeness, or suitability of this information. FXStreet and the author will not be liable for any errors, omissions or any losses, injuries or damages arising from this information and its display or use. Errors and omissions excepted.

The author and FXStreet are not registered investment advisors and nothing in this article is intended to be investment advice.

Recommended content


Recommended content

Editors’ Picks

EUR/USD clings to gains above 1.0750 after US data

EUR/USD clings to gains above 1.0750 after US data

EUR/USD manages to hold in positive territory above 1.0750 despite retreating from the fresh multi-week high it set above 1.0800 earlier in the day. The US Dollar struggles to find demand following the weaker-than-expected NFP data.

EUR/USD News

GBP/USD declines below 1.2550 following NFP-inspired upsurge

GBP/USD declines below 1.2550 following NFP-inspired upsurge

GBP/USD struggles to preserve its bullish momentum and trades below 1.2550 in the American session. Earlier in the day, the disappointing April jobs report from the US triggered a USD selloff and allowed the pair to reach multi-week highs above 1.2600.

GBP/USD News

Gold struggles to hold above $2,300 despite falling US yields

Gold struggles to hold above $2,300 despite falling US yields

Gold stays on the back foot below $2,300 in the American session on Friday. The benchmark 10-year US Treasury bond yield stays in negative territory below 4.6% after weak US data but the improving risk mood doesn't allow XAU/USD to gain traction.

Gold News

Bitcoin Weekly Forecast: Should you buy BTC here? Premium

Bitcoin Weekly Forecast: Should you buy BTC here?

Bitcoin (BTC) price shows signs of a potential reversal but lacks confirmation, which has divided the investor community into two – those who are buying the dips and those who are expecting a further correction.

Read more

Week ahead – BoE and RBA decisions headline a calm week

Week ahead – BoE and RBA decisions headline a calm week

Bank of England meets on Thursday, unlikely to signal rate cuts. Reserve Bank of Australia could maintain a higher-for-longer stance. Elsewhere, Bank of Japan releases summary of opinions.

Read more

Forex MAJORS

Cryptocurrencies

Signatures