|

Silver Price Analysis: XAG/USD resiliently rebounds, claims $23.00 amidst high US bond yields

  • Silver price returns from two-month lows, crosses the 200-day EMA and $23 threshold and ends the week with a 2.89% loss.
  • Despite US data supporting another Fed rate hike and subsequent rise in Treasury bond yields, silver price sustains an upward trajectory, targeting the 100-day EMA.
  • With the Relative Strength Index indicating potential silver weakness, downside risk remains.

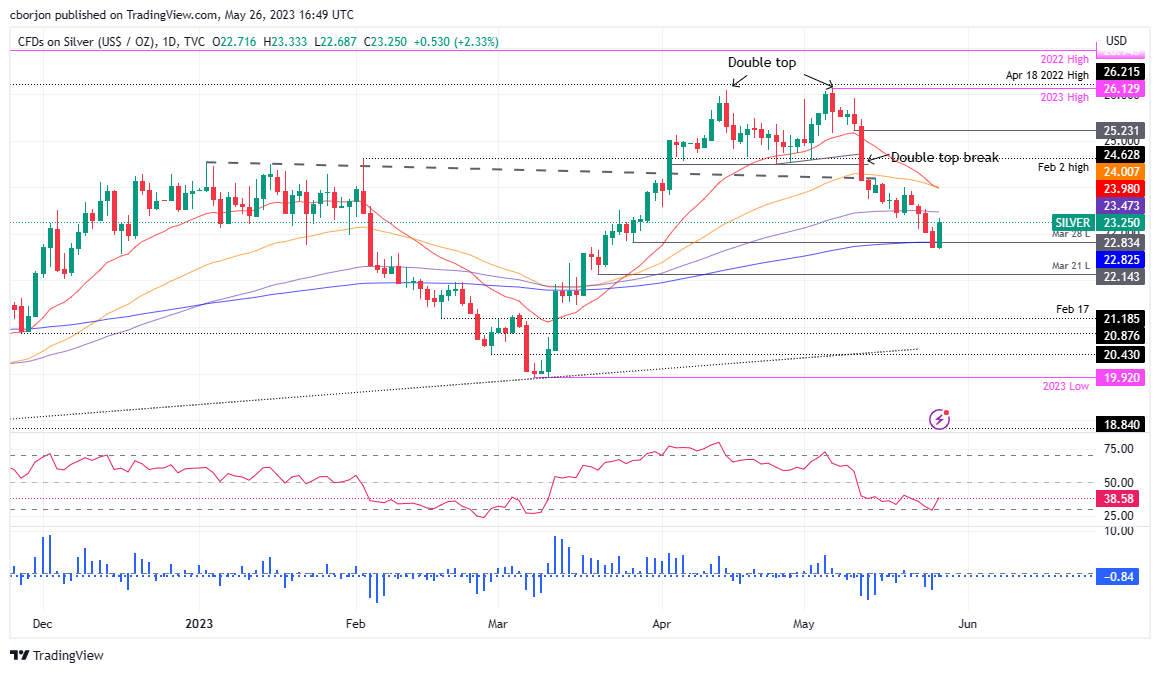
Silver price bounces off two-month-lows hit at $22.68, rallies sharply, and claims the 200-day Exponential Moving Average (EMA) at $22.82 and the $23.00 psychological figure on Friday’s mid-North American session. Although the white metal is gaining more than 1.90%, it is set to finish the week with losses of 2.89%. At the time of writing, XAG/USD is trading at $23.15.

Silver Price Analysis: XAG/USD technical outlook

Even though economic data from the United States (US) justifies another rate hike by the US Federal Reserve (Fed). Therefore, US Treasury bond yields are rising, underpinning the greenback. However, the XAG/USD ignored most factors that could drag the price low and rip higher, eyeing the 100-day Exponential Moving Average (EMA) at $23.47.

Nevertheless, the Relative Strength Index (RSI) is in bearish territory, warranting further Silver weakness, while the 3-day Rate of Change (RoC) has yet to reach neutral levels. Therefore, additional downside could be expected.

However, if XAG/USD clears the 100-day EMA, it would face sold resistance at the confluence of the 20 and 50-day EMAs at around $23.97-24.00. Once broken, the next supply zone would be the $25.00 mark.

On the flip side, and the path of least resistance in the near term, the XAG/USD first support would be $23.00, followed by $22.68, the current week’s low. A beach of the latter will expose the March 21 swing low of $22.14.

Silver Price Action – Daily chart

XAG/USD Daily chart

XAG/USD

Overview
Today last price23.25
Today Daily Change0.51
Today Daily Change %2.24
Today daily open22.74
 
Trends
Daily SMA2024.47
Daily SMA5024.34
Daily SMA10023.36
Daily SMA20022
 
Levels
Previous Daily High23.15
Previous Daily Low22.7
Previous Weekly High24.21
Previous Weekly Low23.33
Previous Monthly High26.09
Previous Monthly Low23.57
Daily Fibonacci 38.2%22.87
Daily Fibonacci 61.8%22.98
Daily Pivot Point S122.58
Daily Pivot Point S222.42
Daily Pivot Point S322.13
Daily Pivot Point R123.03
Daily Pivot Point R223.32
Daily Pivot Point R323.48

Author

Christian Borjon Valencia

Christian Borjon began his career as a retail trader in 2010, mainly focused on technical analysis and strategies around it. He started as a swing trader, as he used to work in another industry unrelated to the financial markets.

More from Christian Borjon Valencia
Share:

Markets move fast. We move first.

Orange Juice Newsletter brings you expert driven insights - not headlines. Every day on your inbox.

By subscribing you agree to our Terms and conditions.

Editor's Picks

EUR/USD holds steady above 1.1750 as traders await FOMC Minutes

The EUR/USD pair holds steady near 1.1770 during the early Asian session on Tuesday. Traders continue to price in the prospect of further rate cuts by the US Federal Reserve in 2026, following the 25-basis-point rate reduction delivered at the December meeting. The release of the Federal Open Market Committee Minutes will be in the spotlight later on Tuesday.

GBP/USD finds key support near 1.35 despite year-end grind

GBP/USD remains bolstered on the high end as markets grind through the last trading week of the year. Cable caught a bullish tilt to keep price action on the high side of the 1.3500 handle, though year-end holiday volumes are unlikely to see significant progress in either direction as 2025 draws to a close.

Gold rebounds to near $4,350 after Monday's 4+% correction

Gold is bouncing to near $4,350 early Tuesday, helped by renewed US Dollar weakness and a dismal mood. Gold was hit sharply by profit-taking on Monday during US trading hours and retreated towards $4,300, where buyers reappeared.

Crypto market outlook for 2026

Year 2025 was volatile, as crypto often is.  Among positive catalysts were favourable regulatory changes in the U.S., rise of Digital Asset Treasuries, adoption of AI and tokenization of Real-World-Assets.

Economic outlook 2026-2027 in advanced countries: Solidity test

After a year marked by global economic resilience and ending on a note of optimism, 2026 looks promising and could be a year of solid economic performance. In our baseline scenario, we expect most of the supportive factors at work in 2025 to continue to play a role in 2026.

Crypto market outlook for 2026

Year 2025 was volatile, as crypto often is.  Among positive catalysts were favourable regulatory changes in the U.S., rise of Digital Asset Treasuries (DAT), adoption of AI and tokenization of Real-World-Assets (RWA).