|

Silver Price Analysis: XAG/USD rebound remains elusive below 200-DMA

  • Silver price snaps four-day downtrend while bouncing off the lowest levels since early November 2022.
  • Bearish MACD signals, sustained trading below 200-DMA keep sellers hopeful.
  • Multiple hurdles stand tall to challenge XAG/USD buyers.

Silver price (XAG/USD) clings to mild gains around $20.70 as bulls struggle to defend the first daily gains in five during early Tuesday.

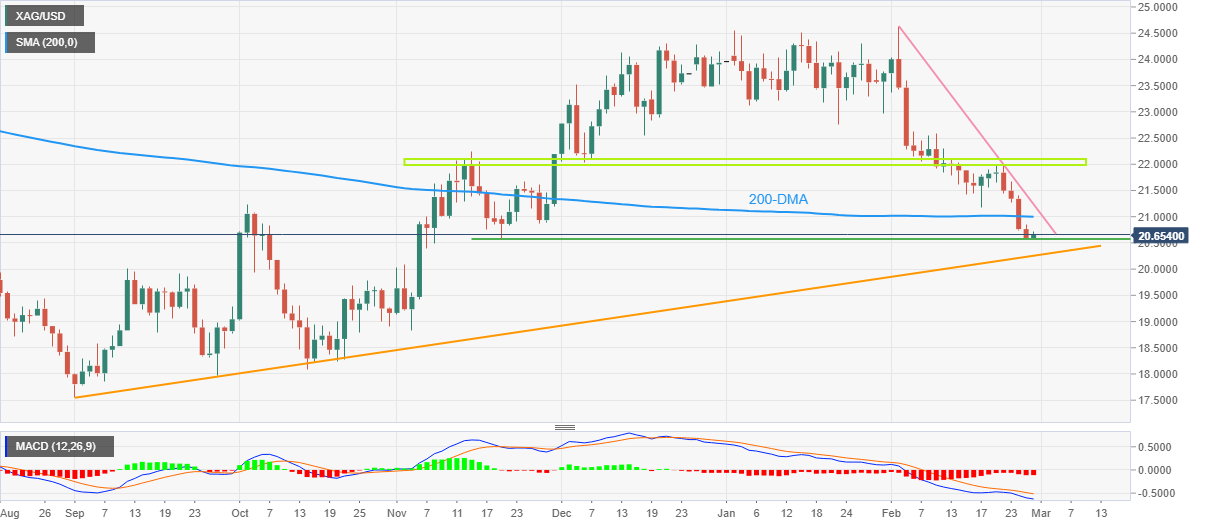
That said, the bright metal dropped to the lowest levels since November 2022 before bouncing off $20.56. The metal’s recovery could be linked to a U-turn from the three-month-old horizontal support.

Despite the latest rebound, the XAG/USD remains on the seller’s radar as it stays below the 200-DMA amid bearish MACD signals.

Even if the precious metal crosses the 200-DMA hurdle of $21.00, a downward-sloping resistance line from February 02, close to $21.25 by the press time, could challenge the Silver buyers afterward.

It’s worth observing that the XAG/USD bears remain hopeful unless the quote stays below the $22.00-10 resistance area comprising multiple tops marked since the last November.

On the contrary, a daily closing below the aforementioned three-month-old horizontal support near $20.50 will challenge an ascending support line from early September 2022, around $20.25 to please the Silver bears.

It should be noted that the $20.00 psychological magnet acts as an extra filter toward the south.

Overall, the Silver price remains weak unless breaking the $22.10 hurdle. The downside moves, however, appear to have limited room towards the south.

Silver price: Daily chart

Trend: Bearish

Additional important levels

Overview
Today last price20.67
Today Daily Change0.08
Today Daily Change %0.39%
Today daily open20.59
 
Trends
Daily SMA2022.05
Daily SMA5023.09
Daily SMA10022.03
Daily SMA20021
 
Levels
Previous Daily High20.84
Previous Daily Low20.56
Previous Weekly High21.98
Previous Weekly Low20.74
Previous Monthly High24.55
Previous Monthly Low22.76
Daily Fibonacci 38.2%20.67
Daily Fibonacci 61.8%20.74
Daily Pivot Point S120.48
Daily Pivot Point S220.38
Daily Pivot Point S320.2
Daily Pivot Point R120.77
Daily Pivot Point R220.95
Daily Pivot Point R321.05

Author

Anil Panchal

Anil Panchal

FXStreet

Anil Panchal has nearly 15 years of experience in tracking financial markets. With a keen interest in macroeconomics, Anil aptly tracks global news/updates and stays well-informed about the global financial moves and their implications.

More from Anil Panchal
Share:

Editor's Picks

AUD/USD eyes 0.7150 barrier nine-day EMA

AUD/USD inches higher after registering modest losses in the previous day, trading around 0.7130 during the Asian hours. The technical analysis of the daily chart indicates that the pair is moving sideways within the rectangle pattern, suggesting a consolidation as neither the bulls nor the bears have enough momentum to take control of the market.

USD/JPY trades below 160.00 intervention threshold; bullish bias intact

The USD/JPY pair attracts some sellers during the Asian session amid fears that authorities will step in again to prop up the Japanese Yen. Furthermore, the Israel-Lebanon truce prompts some profit-taking around the US Dollar and exerts downward pressure on the currency pair.

Gold puts its 200-day SMA to the test near $4,420

Gold keeps the bullish stance in place in the latter part of Thursday’s session, although a convincing break above the key $4,500 mark per troy ounce still remains elusive. The precious metal’s advance comes amid the resurgence of some selling interest around the Greenback, improving risk sentiment, and declining US Treasury yields across the board.

Bitcoin’s massive storm is back: Why the sell-off is far from over

Bitcoin price action over the last few weeks has felt less like a normal, healthy correction and more like a slow grinding crash that continues to wreak havoc on holdings and trading accounts. And everything suggests that the dramatic crash isn’t over.

Nonfarm payrolls: Testing the limits of Fed policy patience

The upcoming nonfarm payrolls report for May will provide the final update on the US labor market before Kevin Warsh attends his first policy meeting as the new Fed Chair later this month.

Recession on paper: What really moves the Canadian Loonie now?

Statistics Canada handed the headline writers a gift and the analysts a headache. Real GDP shrank 0.1% on an annualized basis in the first quarter, and with the fourth quarter of 2025 revised down to a 1.0% contraction, that is two negative quarters in a row, the textbook definition of a technical recession and Canada's first since the pandemic.