Silver Price Analysis: XAG/USD pulls back from two-week peak, downside seems limited
- Silver snaps a five-day winning streak to a nearly two-week top, albeit lacks follow-through.
- The technical setup favors bullish traders and supports prospects for further near-term gains.
- A convincing break below the $28.80-70 area is needed to negate the constructive outlook.

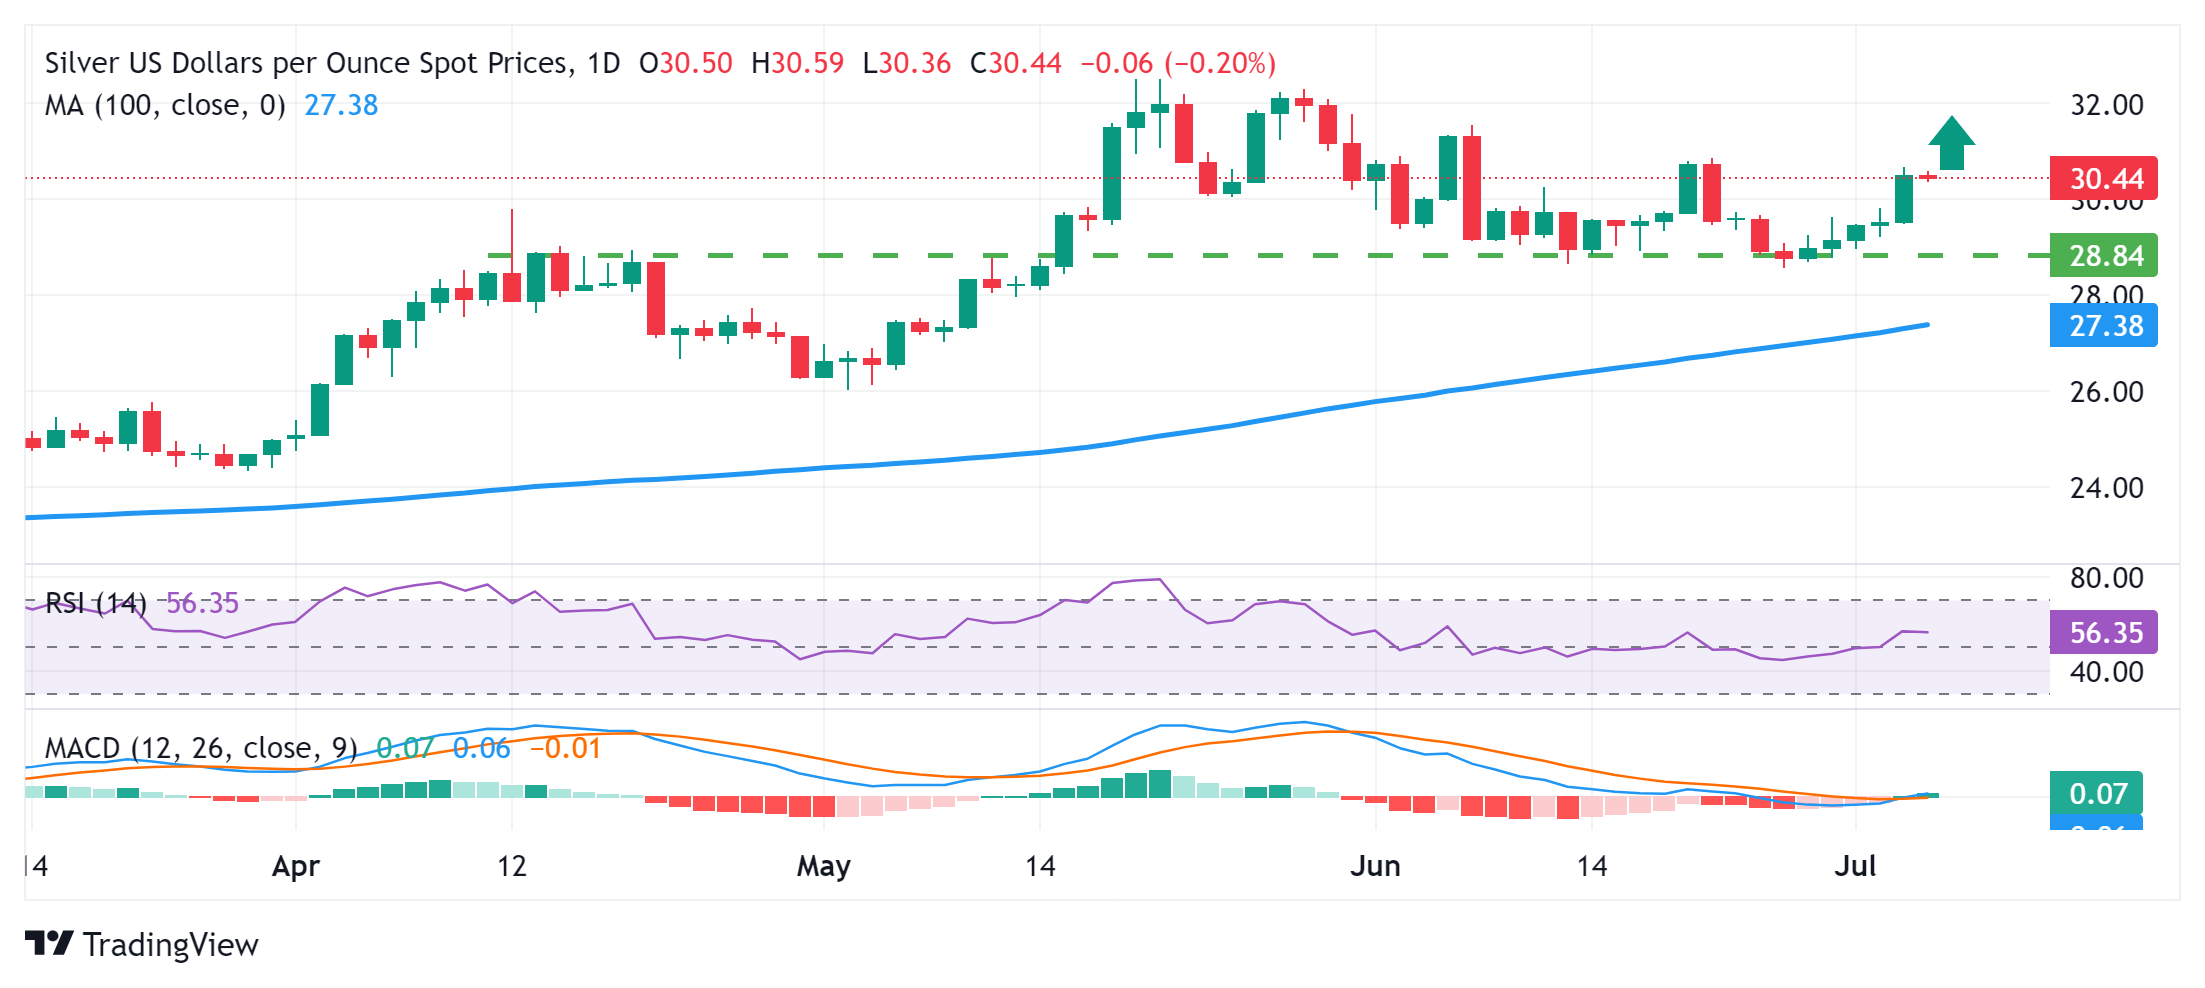
Silver (XAG/USD) ticks lower during the Asian session on Thursday and erodes a part of the previous day's strong gains to the $30.65-$30.70 area, or its highest level in nearly two weeks. The white metal currently trades around the $30.40 region, down 0.35% for the day, and for now, seems to have snapped a five-day winning streak, though the near-term technical setup seems tilted in favor of bullish traders.
The XAG/USD recently showed some resilience below the $28.80-$28.70 horizontal resistance breakpoint-turned-support. The subsequent move beyond the $29.70-$29.75 hurdle and the $30.00 psychological mark was seen as a fresh trigger for bullish traders. Moreover, oscillators on the daily chart have just started gaining positive traction and suggest that the path of least resistance for the metal is to the upside.
Hence, any further decline is more likely to attract fresh buyers near the $30.00 round figure, which should limit the downside near the $29.75-$29.70 resistance-turned-support. The latter should act as a pivotal point, which if broken decisively might prompt some technical selling and accelerate the fall towards the $29.10-$29.00 region before the XAG/USD eventually drops to the $28.80-$28.70 key support zone.
On the flip side, some follow-through buying beyond the overnight swing high, around the $30.70 region, has the potential to lift the XAG/USD beyond the $31.00 mark, towards the next relevant hurdle near the $31.50-$31.55 area. The upward trajectory could extend further towards the $32.00 round figure en route to the $32.50 region, or over a one-decade peak touched in May.
Silver daily chart
Silver FAQs
Silver is a precious metal highly traded among investors. It has been historically used as a store of value and a medium of exchange. Although less popular than Gold, traders may turn to Silver to diversify their investment portfolio, for its intrinsic value or as a potential hedge during high-inflation periods. Investors can buy physical Silver, in coins or in bars, or trade it through vehicles such as Exchange Traded Funds, which track its price on international markets.
Silver prices can move due to a wide range of factors. Geopolitical instability or fears of a deep recession can make Silver price escalate due to its safe-haven status, although to a lesser extent than Gold's. As a yieldless asset, Silver tends to rise with lower interest rates. Its moves also depend on how the US Dollar (USD) behaves as the asset is priced in dollars (XAG/USD). A strong Dollar tends to keep the price of Silver at bay, whereas a weaker Dollar is likely to propel prices up. Other factors such as investment demand, mining supply – Silver is much more abundant than Gold – and recycling rates can also affect prices.
Silver is widely used in industry, particularly in sectors such as electronics or solar energy, as it has one of the highest electric conductivity of all metals – more than Copper and Gold. A surge in demand can increase prices, while a decline tends to lower them. Dynamics in the US, Chinese and Indian economies can also contribute to price swings: for the US and particularly China, their big industrial sectors use Silver in various processes; in India, consumers’ demand for the precious metal for jewellery also plays a key role in setting prices.
Silver prices tend to follow Gold's moves. When Gold prices rise, Silver typically follows suit, as their status as safe-haven assets is similar. The Gold/Silver ratio, which shows the number of ounces of Silver needed to equal the value of one ounce of Gold, may help to determine the relative valuation between both metals. Some investors may consider a high ratio as an indicator that Silver is undervalued, or Gold is overvalued. On the contrary, a low ratio might suggest that Gold is undervalued relative to Silver.
Author

Haresh Menghani
FXStreet
Haresh Menghani is a detail-oriented professional with 10+ years of extensive experience in analysing the global financial markets.


