|

Silver Price Analysis: XAG/USD pullback from $25.60 on the cards

  • Silver pares the biggest daily gains in a month at weekly top.
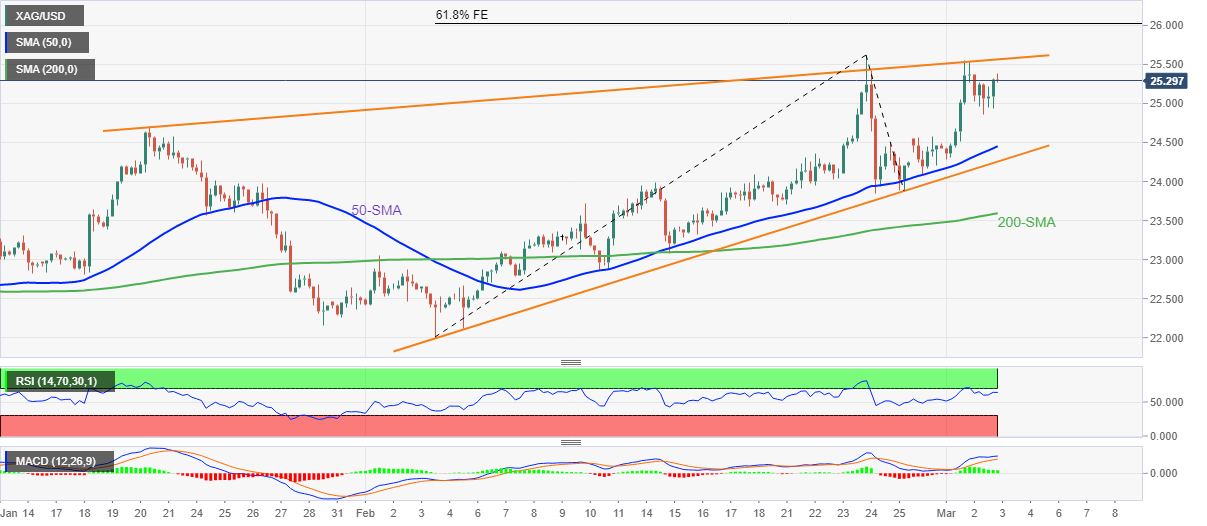
  • RSI conditions, six-week-old ascending resistance line challenge further upside.
  • Bears remain cautious until witnessing a clear break of 200-SMA, 61.8% FE could lure buyers past $25.60.

Silver (XAG/USD) bulls take a breather around $25.30 during Thursday’s Asian session, following a notable run-up to refresh the week’s top.

Although the metal’s sustained trading above the key SMAs and bullish MACD signals favor XAG/USD buyers, an upward sloping trend line from January 20, around $25.60, has been successful in turning down the bulls of late.

Also, favoring the odds of a profit-booking wave is the RSI line that inches closer to overbought territory.

In a case where the silver prices rise past $25.60, the 61.8% Fibonacci Expansion (FE) of February month moves, around $26.00, will be crucial to watch as it holds the key to further rally targeting July 2021 peak of $26.77.

Alternatively, the recent swing low near $24.90 and January’s high of $24.70 could entertain intraday sellers of XAG/USD.

Following that, the 50-SMA and an upward sloping trend line from February 03, respectively around $24.45 and $24.25, will tease silver bears.

It should be noted, however, that a clear downside break of the $24.25 will need validation from the 200-SMA level of $23.60, to portray a short-term bearish trend.

Silver: Four-hour chart

Trend: Pullback expected

Additional important levels

Overview
Today last price25.3
Today Daily Change-0.18
Today Daily Change %-0.71%
Today daily open25.48
 
Trends
Daily SMA2023.68
Daily SMA5023.32
Daily SMA10023.42
Daily SMA20024.15
 
Levels
Previous Daily High25.54
Previous Daily Low24.28
Previous Weekly High25.62
Previous Weekly Low23.7
Previous Monthly High25.62
Previous Monthly Low22.01
Daily Fibonacci 38.2%25.06
Daily Fibonacci 61.8%24.77
Daily Pivot Point S124.66
Daily Pivot Point S223.84
Daily Pivot Point S323.4
Daily Pivot Point R125.92
Daily Pivot Point R226.36
Daily Pivot Point R327.18

Author

Anil Panchal

Anil Panchal

FXStreet

Anil Panchal has nearly 15 years of experience in tracking financial markets. With a keen interest in macroeconomics, Anil aptly tracks global news/updates and stays well-informed about the global financial moves and their implications.

More from Anil Panchal
Share:

Editor's Picks

AUD/USD eyes 0.7150 barrier nine-day EMA

AUD/USD inches higher after registering modest losses in the previous day, trading around 0.7130 during the Asian hours. The technical analysis of the daily chart indicates that the pair is moving sideways within the rectangle pattern, suggesting a consolidation as neither the bulls nor the bears have enough momentum to take control of the market.

USD/JPY trades below 160.00 intervention threshold; bullish bias intact

The USD/JPY pair attracts some sellers during the Asian session amid fears that authorities will step in again to prop up the Japanese Yen. Furthermore, the Israel-Lebanon truce prompts some profit-taking around the US Dollar and exerts downward pressure on the currency pair.

Gold puts its 200-day SMA to the test near $4,420

Gold keeps the bullish stance in place in the latter part of Thursday’s session, although a convincing break above the key $4,500 mark per troy ounce still remains elusive. The precious metal’s advance comes amid the resurgence of some selling interest around the Greenback, improving risk sentiment, and declining US Treasury yields across the board.

Bitcoin’s massive storm is back: Why the sell-off is far from over

Bitcoin price action over the last few weeks has felt less like a normal, healthy correction and more like a slow grinding crash that continues to wreak havoc on holdings and trading accounts. And everything suggests that the dramatic crash isn’t over.

Nonfarm payrolls: Testing the limits of Fed policy patience

The upcoming nonfarm payrolls report for May will provide the final update on the US labor market before Kevin Warsh attends his first policy meeting as the new Fed Chair later this month.

Recession on paper: What really moves the Canadian Loonie now?

Statistics Canada handed the headline writers a gift and the analysts a headache. Real GDP shrank 0.1% on an annualized basis in the first quarter, and with the fourth quarter of 2025 revised down to a 1.0% contraction, that is two negative quarters in a row, the textbook definition of a technical recession and Canada's first since the pandemic.