Silver Price Analysis: XAG/USD jumps back closer to YTD top, seems poised to climb further


  • Silver scales higher for the fourth straight day and spikes to a one-and-half-week high.
  • The technical setup favours bullish traders and supports prospects for additional gains.
  • Any meaningful corrective decline is likely to find decent support near the $25.00 mark.

Silver (XAG/USD) gains positive traction for the fourth straight day on Tuesday and climbs further beyond mid-$25.00s during the first half of the European session, back closer to the YTD peak touched last week.

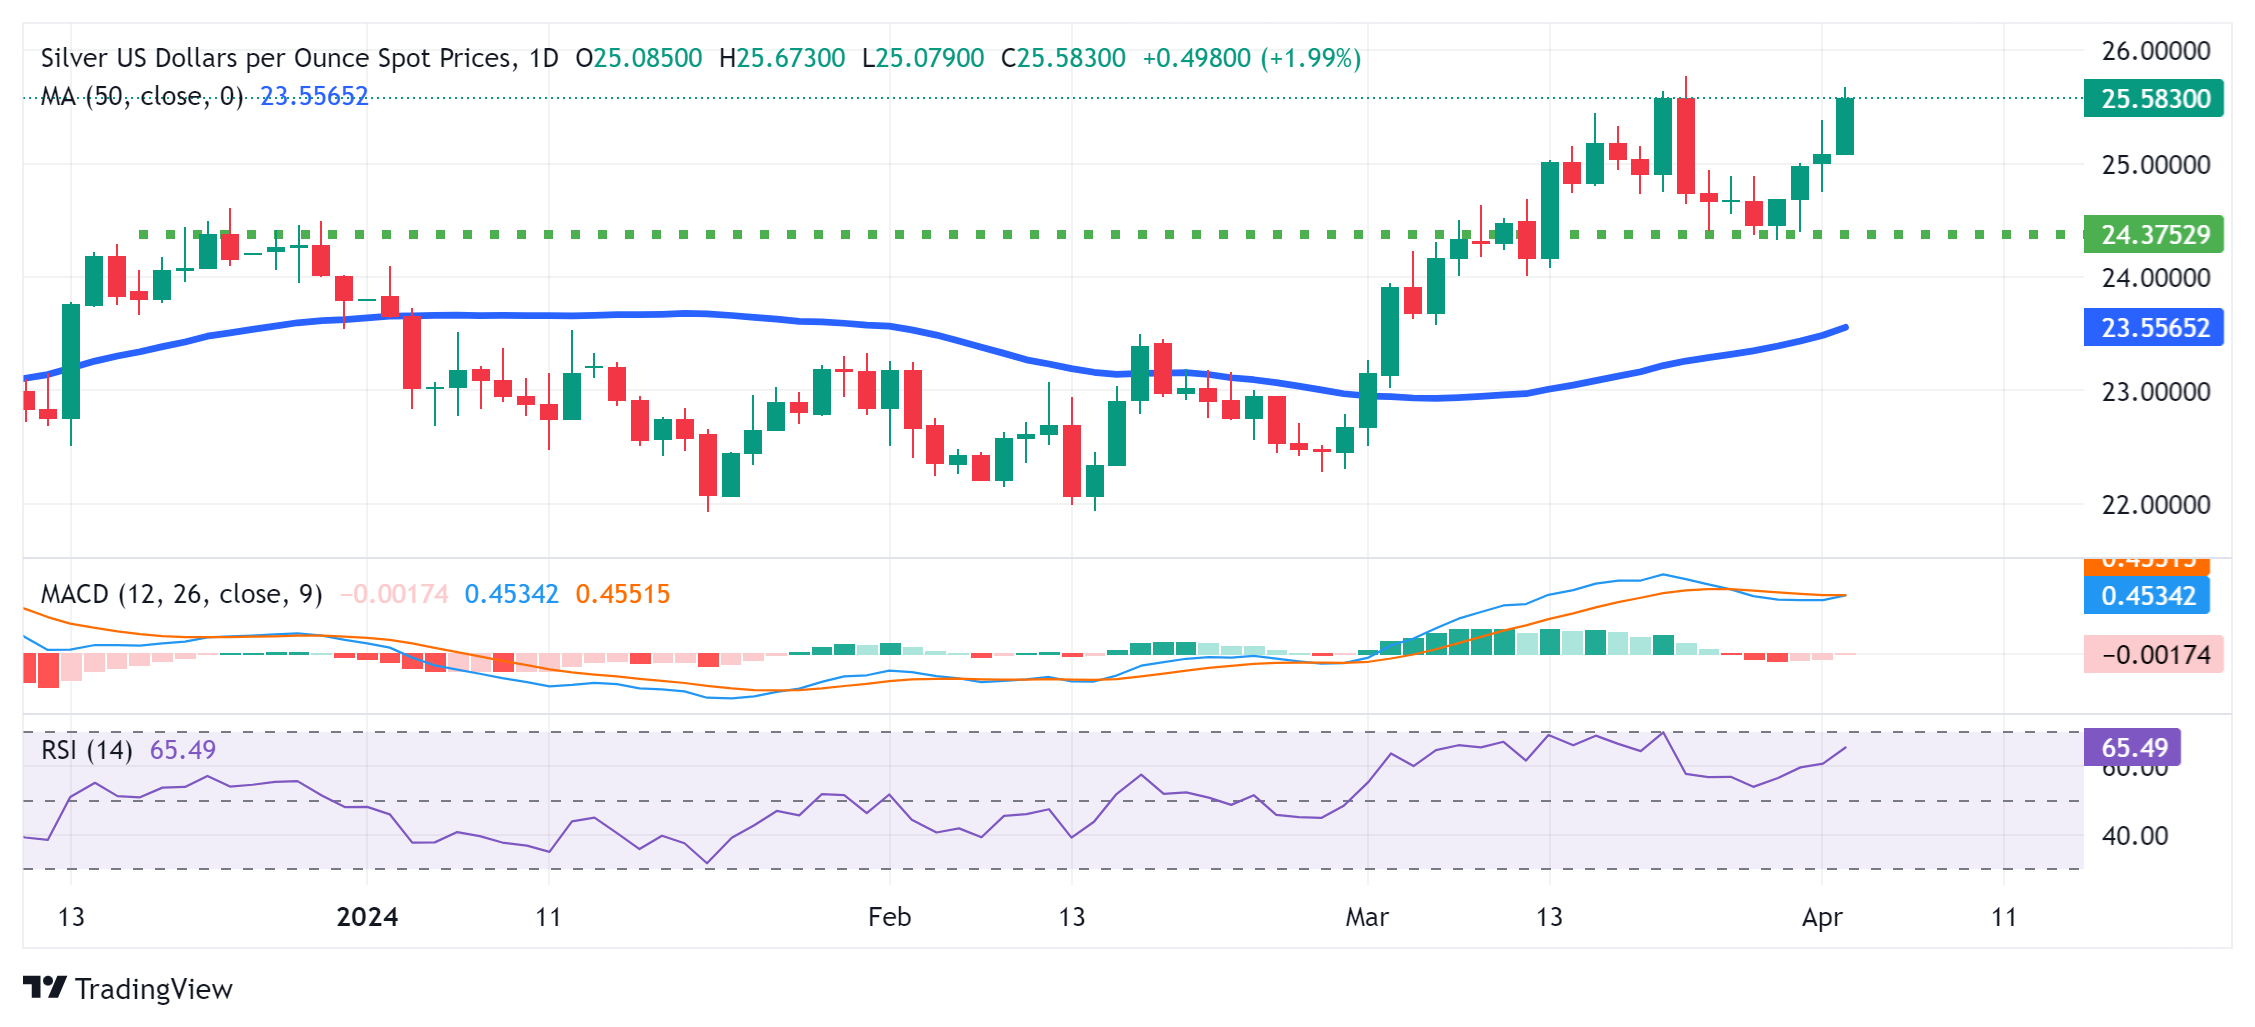
From a technical perspective, the recent bounce from the $24.35 resistance-turned-support zone and a subsequent strong move up favours bullish traders. Moreover, oscillators on the daily chart are holding in the positive territory and are still far from being in the overbought zone, suggesting that the path of least resistance for the XAG/USD is to the upside.

Hence, some follow-through strength towards testing the December 2023 swing high, just ahead of the $26.00 round figure, looks like a distinct possibility. Some follow-through buying would mark a fresh breakout and allow the XAG/USD to resume its recent strong upward trajectory witnessed since late February.

On the flip side, any meaningful corrective decline is more likely to attract fresh buyers near the $25.00 psychological mark. The next relevant support is pegged near the $24.65 region. A convincing break below the latter could drag the XAG/USD towards the aforementioned resistance-turned-support, around the $24.35 zone, which should act as a key pivotal point.

Some follow-through selling might shift the bias in favour of bearish traders and make the XAG/USD vulnerable to accelerate the decline further towards the $24.15-$24.10 region. The white metal could eventually weaken below the $24.00 round-figure mark, towards the 50-day Simple Moving Average (SMA), currently pegged near the $23.60 zone.

Silver daily chart

fxsoriginal

XAG/USD

Overview
Today last price 25.62
Today Daily Change 0.54
Today Daily Change % 2.15
Today daily open 25.08
 
Trends
Daily SMA20 24.64
Daily SMA50 23.49
Daily SMA100 23.58
Daily SMA200 23.39
 
Levels
Previous Daily High 25.38
Previous Daily Low 24.75
Previous Weekly High 25
Previous Weekly Low 24.33
Previous Monthly High 25.77
Previous Monthly Low 22.51
Daily Fibonacci 38.2% 25.14
Daily Fibonacci 61.8% 24.99
Daily Pivot Point S1 24.76
Daily Pivot Point S2 24.43
Daily Pivot Point S3 24.12
Daily Pivot Point R1 25.4
Daily Pivot Point R2 25.71
Daily Pivot Point R3 26.04


Share: Feed news

Information on these pages contains forward-looking statements that involve risks and uncertainties. Markets and instruments profiled on this page are for informational purposes only and should not in any way come across as a recommendation to buy or sell in these assets. You should do your own thorough research before making any investment decisions. FXStreet does not in any way guarantee that this information is free from mistakes, errors, or material misstatements. It also does not guarantee that this information is of a timely nature. Investing in Open Markets involves a great deal of risk, including the loss of all or a portion of your investment, as well as emotional distress. All risks, losses and costs associated with investing, including total loss of principal, are your responsibility. The views and opinions expressed in this article are those of the authors and do not necessarily reflect the official policy or position of FXStreet nor its advertisers. The author will not be held responsible for information that is found at the end of links posted on this page.

If not otherwise explicitly mentioned in the body of the article, at the time of writing, the author has no position in any stock mentioned in this article and no business relationship with any company mentioned. The author has not received compensation for writing this article, other than from FXStreet.

FXStreet and the author do not provide personalized recommendations. The author makes no representations as to the accuracy, completeness, or suitability of this information. FXStreet and the author will not be liable for any errors, omissions or any losses, injuries or damages arising from this information and its display or use. Errors and omissions excepted.

The author and FXStreet are not registered investment advisors and nothing in this article is intended to be investment advice.

Recommended content


Recommended content

Editors’ Picks

EUR/USD bounces off lows, back near 1.1330

EUR/USD bounces off lows, back near 1.1330

EUR/USD meets daily support around the 1.1300 neighbourhood, managing to regain pace and revisit the 1.1330 region. Sentiment turned after President Trump proposed a “straight 50% tariff” on European imports, undermining the pair’s bullish momentum.

GBP/USD eases from tops, revisits the 1.3500 zone

GBP/USD eases from tops, revisits the 1.3500 zone

GBP/USD benefits from broad US Dollar weakness, climbing to its highest level since February 2022 past 1.3500 at the end of the week. UK retail sales data surprised to the upside in April, lending extra wings to the quid.

Gold keeps the bullish tone near $3,350

Gold keeps the bullish tone near $3,350

Gold extends its weekly advance, trading around $3,350 per troy ounce on Friday. The rally in XAU/USD is driven by broad-based weakness in the Greenback, particulalry after President Trump’s threat to impose 50% tariffs on European imports.

Apple stock sinks below $200 after Trump threatens more tariffs

Apple stock sinks below $200 after Trump threatens more tariffs Premium

Trump grows irate at Apple's move into India. President claims Apple must produce US-sold iPhone in US or face a 25% tariff. US equity futures slip more than 1% in Friday premarket after Trump threatens the EU with a 50% tariff.

Ripple Price Prediction: Whale accumulation sparks hope as rising exchange reserves signal caution

Ripple Price Prediction: Whale accumulation sparks hope as rising exchange reserves signal caution

XRP sustains mid-week recovery as XRP/BTC flashes golden cross for the first time since 2017. Large volume holders increase XRP exposure, indicating rising demand and investor confidence.

The Best brokers to trade EUR/USD

The Best brokers to trade EUR/USD

SPONSORED Discover the top brokers for trading EUR/USD in 2025. Our list features brokers with competitive spreads, fast execution, and powerful platforms. Whether you're a beginner or an expert, find the right partner to navigate the dynamic Forex market.

Forex MAJORS

Cryptocurrencies

Signatures

Best Brokers of 2025