|

Silver Price Analysis: XAG/USD hits one-week low, manages to hold above $24.00 mark

  • Silver edges lower for the fourth successive day and touches a one-week low on Monday.
  • The mixed oscillators on hourly/daily charts warrant caution before placing directional bets.
  • A sustained move beyond the $25.00 mark will be seen as a fresh trigger for bullish traders.

Silver remains on the defensive for the fourth successive day on Monday and drops to a one-week low during the early part of the European session, though manages to hold above the $24.00 round-figure mark.

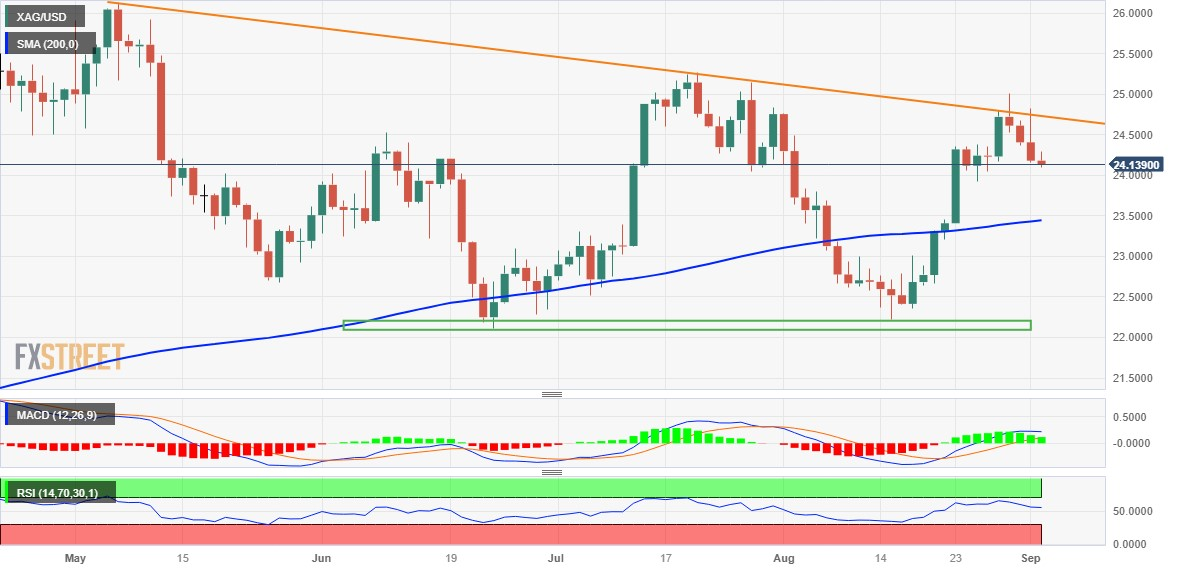
The downtick could be attributed to some technical selling after last week's repeated failures to break through a descending trend line extending from over a one-year high, around the $26.10-$26.15 region touched in May. That said, mixed oscillators on hourly/daily charts warrant some caution before placing bearish bets around the XAG/USD and positioning for any further decline.

Hence, any subsequent fall is more likely to find some support near the 200-period Simple Moving Average (SMA) on the 4-hour chart, currently pegged around the $23.80 region. Some follow-through selling, however, should pave the way for a fall towards the $23.55 region, which is closely followed by the 200-day SMA, near the $23.40 region. The latter should act as a pivotal point for the XAG/USD.

A convincing break below will be seen as a fresh trigger for bearish traders and expose the $23.00 round figure. The downward trajectory could get extended further and drag the XAG/USD towards strong horizontal support near the $22.20-$22.10 region.

On the flip side, the $24.30-$24.35 area now seems to act as an immediate hurdle ahead of the aforementioned descending trend-line resistance, currently around the $24.75 region. This is followed by the $25.00 psychological mark and July monthly swing high, around the $25.25 region. A sustained strength beyond should allow the XAG/USD to make a fresh attempt to conquer the $26.00 mark.

Silver daily chart

fxsoriginal

Technical levels to watch

XAG/USD

Overview
Today last price24.14
Today Daily Change-0.04
Today Daily Change %-0.17
Today daily open24.18
 
Trends
Daily SMA2023.43
Daily SMA5023.68
Daily SMA10023.93
Daily SMA20023.43
 
Levels
Previous Daily High24.82
Previous Daily Low24.16
Previous Weekly High25.02
Previous Weekly Low24.05
Previous Monthly High25.02
Previous Monthly Low22.23
Daily Fibonacci 38.2%24.41
Daily Fibonacci 61.8%24.57
Daily Pivot Point S123.95
Daily Pivot Point S223.72
Daily Pivot Point S323.28
Daily Pivot Point R124.62
Daily Pivot Point R225.06
Daily Pivot Point R325.29

Author

Haresh Menghani

Haresh Menghani is a detail-oriented professional with 10+ years of extensive experience in analysing the global financial markets.

More from Haresh Menghani
Share:

Editor's Picks

AUD/USD consolidates above 0.7000/two-month low; bearish potential intact

The AUD/USD pair oscillates in a narrow range during the Asian session, and moves little following the release of mixed inflation figures from China. Spot prices currently trade around the 0.7025 region, nearly unchanged for the day, and remain within striking distance of a nearly two-month low set on Tuesday. Renewed hostilities between the US and Iran temper hopes for a deal to end the over three-month-old war.

Japanese Yen languishes despite wholesale inflation accelerates in May

USD/JPY flatlines after experiencing volatility, trading around 160.40 during the Asian hours on Wednesday. The pair continues to hold its ground, reflecting a struggling Japanese Yen that has failed to find support despite a massive acceleration in wholesale inflation. Driven by surging energy costs linked to the ongoing Middle East conflict, Japan’s Producer Price Index jumped 6.3% year-over-year in May. This hot printing comfortably outpaced April’s upwardly revised 5.3% figure and surpassed market consensus of 5.5%, marking the fastest pace of wholesale price growth in three years.

$4,200: Gold retains bearish bias near March low ahead of US CPI

Gold recovers slightly after touching a fresh low since March 23, though it retains a bearish bias near the $4,200 mark through the early European session. Renewed hostilities between the US and Iran fuel inflationary concerns and bolster bets for more hawkish central banks, which is seen as a key factor driving flows away from the non-yielding yellow metal. Furthermore, the decline could be attributed to technical selling following the recent breakdown below the very important 200-day SMA.

Cardano's downtrend deepens despite on-chain bottoming signals

Cardano edges lower to $0.1600 signaling a potential extension of the 30% loss from last week. The altcoin remains under intense selling pressure, weighing on its retail support. Still, a spike in dormant supply re-entering circulation signals that the selling pressure has run its course, a pattern that often precedes a rebound.

US CPI data set to show inflation at three-year high in May, backing Fed hawkish tilt

The US Bureau of Labor Statistics will publish the May Consumer Price Index (CPI) data on Wednesday. The report is expected to show another step up in consumer inflation, driven by the persistently high Oil prices due to the ongoing crisis in the Middle East.

The US economy defies the rules: 100 days into the Oil shock and the recession signal is still missing

More than three months after the start of the Iran war and the resulting disruption to global energy markets, the US economy continues to display remarkable resilience. The conflict has triggered a sharp rise in Oil prices, reignited inflationary pressures and fueled widespread concerns about a potential economic slowdown.