|

Silver Price Analysis: XAG/USD hangs near one-week low, just above mid-$24.00s

  • Silver drifts lower for the second straight day and touches a one-and-half-week low.
  • The mixed technical setup warrants caution before placing aggressive bearish bets.
  • A convincing break below the 38.2% Fibo. level will set the stage for deeper losses.

Silver (XAG/USD) extends the previous day's sharp retracement slide from the $25.75-$25.80 region, or its highest level since early December and remains under some selling pressure for the second straight day on Friday. The white metal maintains its offered tone through the early part of the European session and is currently placed around mid-$24.00s, just above a one-and-half-week low touched earlier today.

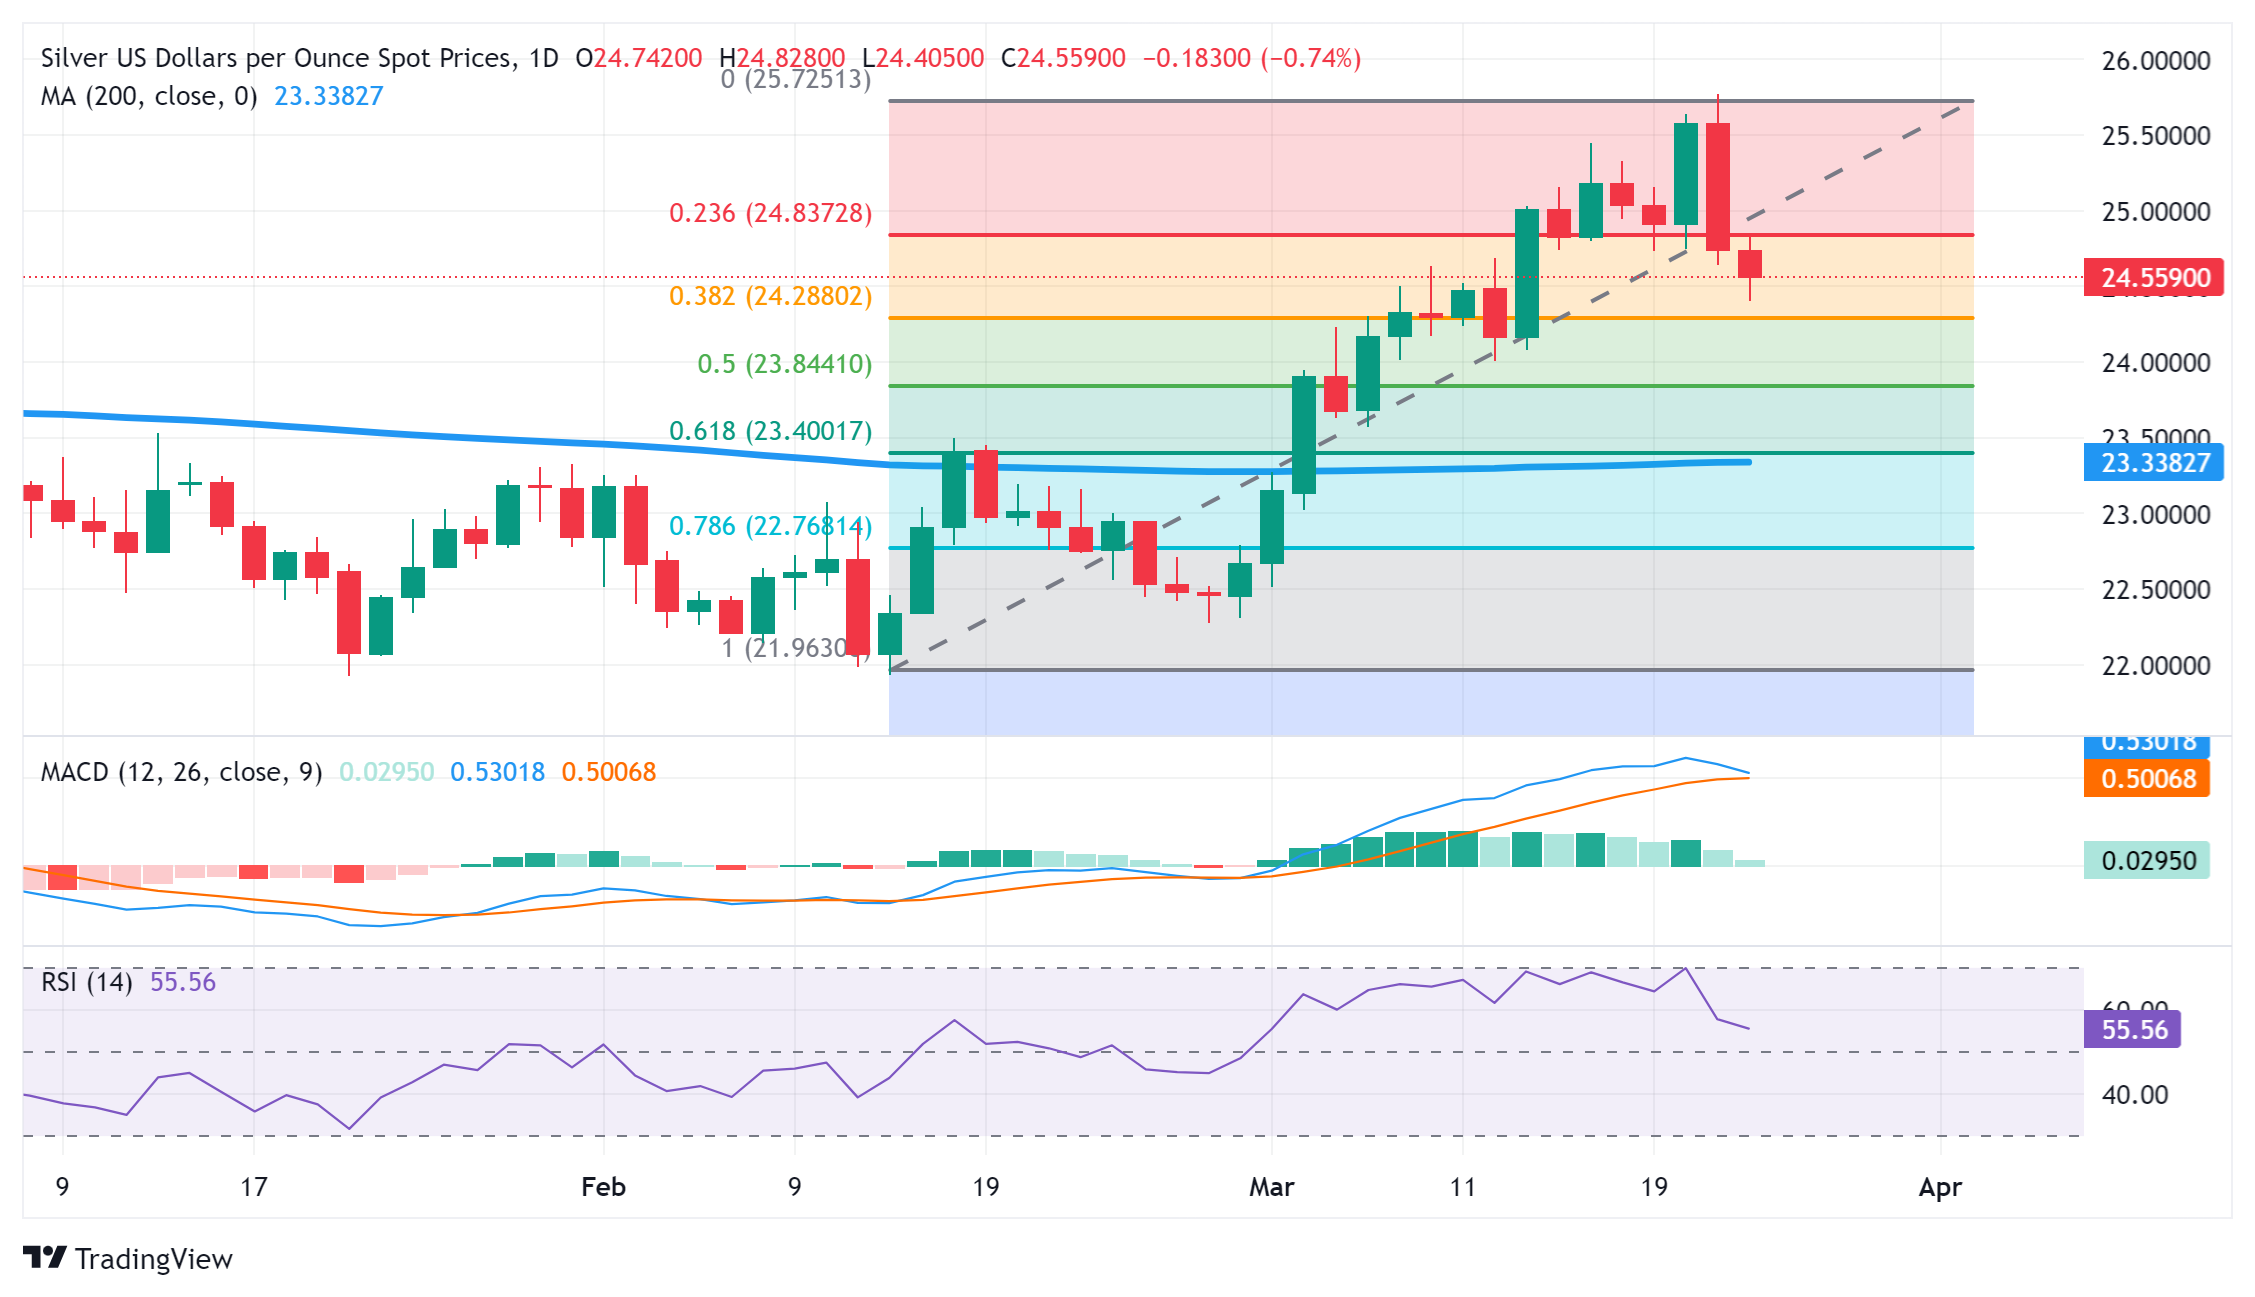
From a technical perspective, the overnight breakdown through the $24.85-$24.80 horizontal support, coinciding with the 23.6% Fibonacci retracement level of the February-March rally was seen as a fresh trigger for bearish traders. The subsequent slide, however, stalls ahead of the 38.2% Fibo. level, which should now act as a key pivotal point. Meanwhile, oscillators on the daily chart – though have been losing traction – are still holding in the positive territory.

Hence, it will be prudent to wait for a sustained break below the said support near the $24.30 region before positioning for any further depreciating move for the XAG/USD. The corrective decline could then drag the white metal below the $24.00 round-figure mark, towards testing the 50% Fibo. level support near the $23.85 zone en route to the $23.40 confluence, comprising the 61.8% Fibo. and the very important 200-day Simple Moving Average (SMA).

On the flip side, the $24.80 horizontal support breakpoint could act as an immediate hurdle ahead of the $25.00 psychological mark. A sustained strength beyond the latter might trigger a bout of a short-covering rally towards the $25.50 region en route to the YTD peak, around the $25.75-$25.80 region. This is followed by the December 2023 swing high, just ahead of the $26.00 round figure, which if cleared decisively will set the stage for additional gains.

Silver daily chart

fxsoriginal

XAG/USD

Overview
Today last price24.58
Today Daily Change-0.16
Today Daily Change %-0.65
Today daily open24.74
 
Trends
Daily SMA2024.03
Daily SMA5023.26
Daily SMA10023.46
Daily SMA20023.34
 
Levels
Previous Daily High25.77
Previous Daily Low24.64
Previous Weekly High25.45
Previous Weekly Low24.01
Previous Monthly High23.5
Previous Monthly Low21.93
Daily Fibonacci 38.2%25.07
Daily Fibonacci 61.8%25.34
Daily Pivot Point S124.33
Daily Pivot Point S223.92
Daily Pivot Point S323.21
Daily Pivot Point R125.46
Daily Pivot Point R226.18
Daily Pivot Point R326.59

Author

Haresh Menghani

Haresh Menghani is a detail-oriented professional with 10+ years of extensive experience in analysing the global financial markets.

More from Haresh Menghani
Share:

Editor's Picks

EUR/USD faces some resistance near 100-SMA on H4, around 1.1830 zone

The EUR/USD pair gains some follow-through positive traction for the second consecutive day and climbs to the 1.1830 region during the Asian session on Thursday. The US Dollar remains on the back foot amid concerns about the economic fallout from US President Donald Trump's erratic trade policies and acts as a tailwind for spot prices.

GBP/USD extends recovery to near 20-day EMA as US Dollar weakens

The Pound Sterling holds onto weekly gains around 1.3565 against the US Dollar during the Asian trading session on Thursday. The GBP/USD pair trades firmly as the US Dollar remains under pressure due to uncertainty surrounding the United States trade policy outlook.

Gold struggle with $5,200 extends ahead of more US-Iran talks

Gold is replicating the recovery moves seen in Wednesday’s Asian trading early Thursday, as buyers continue to flirt with the $5,200 level. Sustained US Dollar weakness and looming US-Iran talks aid the bright metal’s rebound.  

Stellar: Relief bounce fades as bearish undertone persists

Stellar is trading around $0.16 at the time of writing on Thursday after rebounding more than 8% in the previous day. Derivatives data paints a negative picture as XLM’s short bets hit a monthly high while Open Interest continues to decline.

Nvidia delivers another monster earnings report, and forecasts big things to come

It was another monster earnings report from Nvidia for fiscal Q4. Revenues were $68.1bn, smashing estimates of $65bn. Gross profit margin was a healthy 75%, up from 73.5% in the prior quarter, and the outlook for this quarter was monstrous.

Cosmos Hub Price Forecast: ATOM rebounds slightly, bearish outlook remains intact

Cosmos Hub (ATOM) price rebounds, trading above $2.05 at the time of writing on Wednesday, after undergoing a sharp correction since last week. Weakening on-chain and derivatives data support a bearish outlook, while technical analysis remains unfavorable.