|

Silver Price Analysis: XAG/USD flirts with YTD peak, bulls await move beyond $24.00 mark

  • Silver reverses an intraday dip and moves back closer to the YTD peak on Tuesday.
  • The technical setup favours bullish traders and supports prospects for further gains.
  • Sustained weakness back below the $23.00 mark will negate the positive outlook.

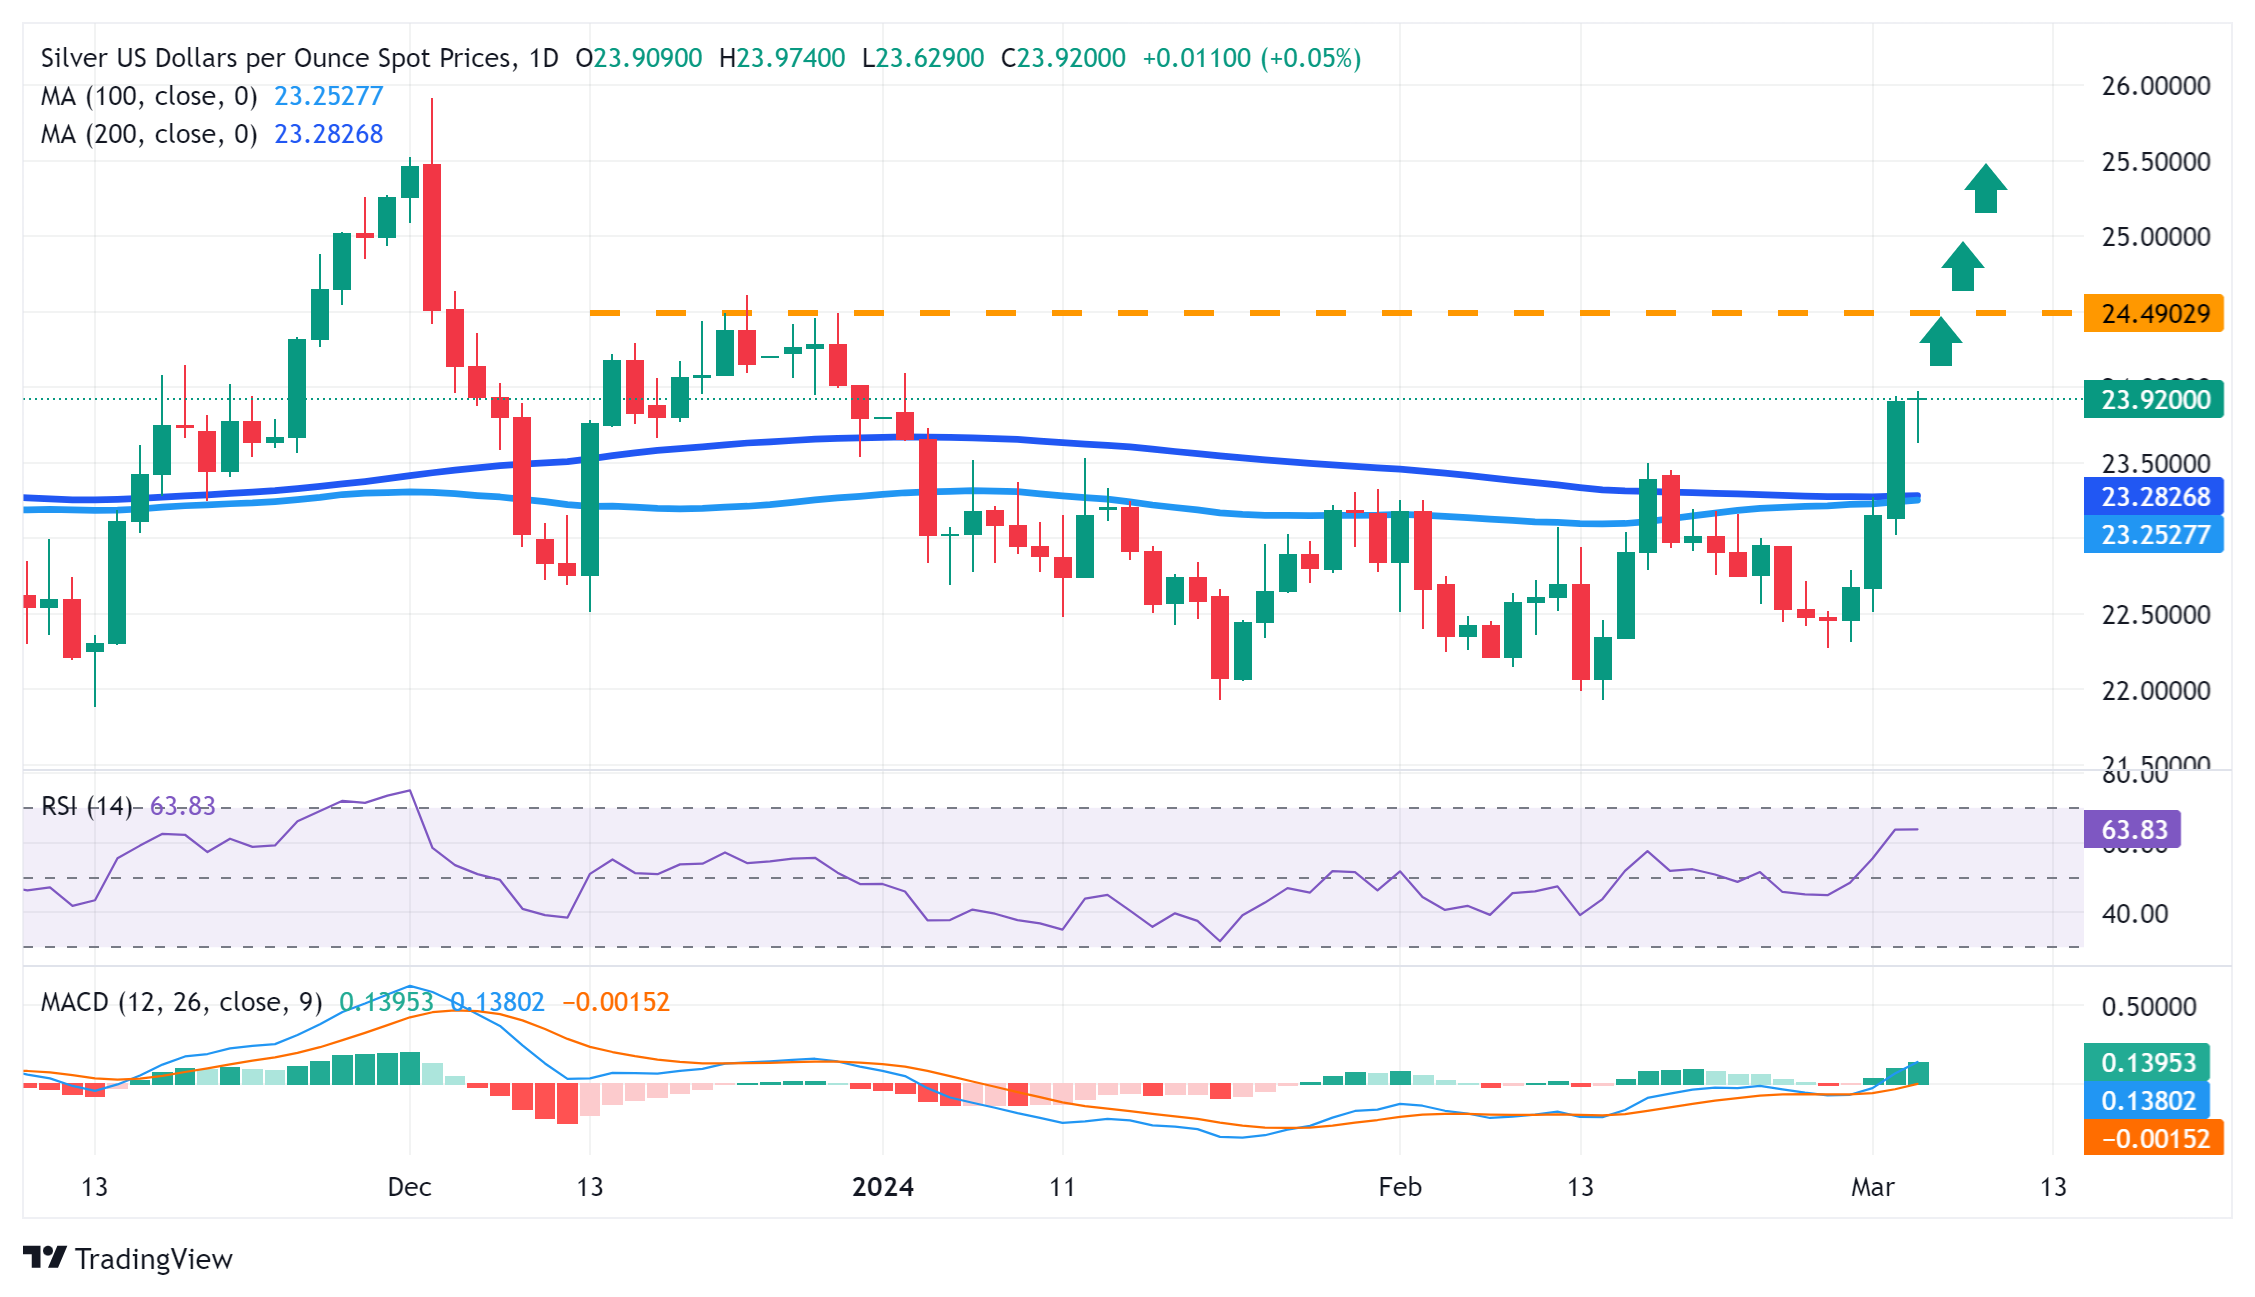
Silver (XAG/USD) attracts some dip-buying near the $23.65-$23.60 region on Tuesday and flirts with the YTD peak during the first half of the European session. The white metal currently trades just below the $24.00 mark and looks to build on the previous day's breakout momentum through the $23.30-$23.35 confluence hurdle.

The latter comprises the 100- and the 200-day Simple Moving Averages (SMA), which should now act as a key pivotal point for the XAG/USD. Any meaningful corrective slide is more likely to get bought into near the said resistance-turned-support and remain limited near the $23.00 round figure. That said, some follow-through selling will suggest that a one-week-old strong rally has run out of steam and pave the way for deeper losses.

The XAG/USD might then accelerate the slide towards the $22.50-$22.45 intermediate support before eventually dropping to sub-$22.00 levels or the two-month trough touched in January and retested in February. The downward trajectory could extend further and drag the white metal further towards the next relevant support near the $21.40-$21.35 region. That said, positive oscillators on the daily chart warrant caution for bearish traders.

On the flip side, momentum beyond the $24.00 mark is likely to confront some resistance near the $24.30-$24.35 region ahead of the $24.50 supply zone. A sustained strength beyond should allow the XAG/USD to reclaim the $25.00 psychological mark and climb further towards the $25.45-$25.50 intermediate hurdle en route to the $26.00 neighbourhood, or the December 2023 swing high.

Silver daily chart

fxsoriginal

XAG/USD

Overview
Today last price23.94
Today Daily Change0.03
Today Daily Change %0.13
Today daily open23.91
 
Trends
Daily SMA2022.75
Daily SMA5022.94
Daily SMA10023.24
Daily SMA20023.28
 
Levels
Previous Daily High23.94
Previous Daily Low23.02
Previous Weekly High23.27
Previous Weekly Low22.28
Previous Monthly High23.5
Previous Monthly Low21.93
Daily Fibonacci 38.2%23.59
Daily Fibonacci 61.8%23.38
Daily Pivot Point S123.31
Daily Pivot Point S222.7
Daily Pivot Point S322.38
Daily Pivot Point R124.23
Daily Pivot Point R224.55
Daily Pivot Point R325.15

Author

Haresh Menghani

Haresh Menghani is a detail-oriented professional with 10+ years of extensive experience in analysing the global financial markets.

More from Haresh Menghani
Share:

Editor's Picks

AUD/USD eyes 0.7150 barrier nine-day EMA

AUD/USD inches higher after registering modest losses in the previous day, trading around 0.7130 during the Asian hours. The technical analysis of the daily chart indicates that the pair is moving sideways within the rectangle pattern, suggesting a consolidation as neither the bulls nor the bears have enough momentum to take control of the market.

USD/JPY trades below 160.00 intervention threshold; bullish bias intact

The USD/JPY pair attracts some sellers during the Asian session amid fears that authorities will step in again to prop up the Japanese Yen. Furthermore, the Israel-Lebanon truce prompts some profit-taking around the US Dollar and exerts downward pressure on the currency pair.

Gold defends 200-day SMA at $4,425, but for how long?

Gold is attempting a tepid recovery toward $4,500 early Thursday, as renewed optimism in the Mideast geopolitical front calms market nerves. This cautious optimism across Asian markets weighs on Oil prices, and diminishes the US Dollar’s safe-haven appeal, helping Gold stage a decent comeback from the weekly low of $4,424.


Hyperliquid: ETF demand, capital rotation fuel HYPE rally as Bitcoin melts

Hyperliquid price sustains an upward trend near its all-time high of $75.76 on Thursday after posting 80% gains in May, while Bitcoin (BTC) retraces below $65,000, triggering a market-wide panic.

Kevin Warsh takes the Fed helm: What it means for the US Dollar
The Federal Reserve moves away from the highly predictable "forward guidance" model of the Jerome Powell era to a new “Kevin Warsh environment”, characterized by less communication, more policy surprises, and an increased focus on the Fed's complex balance sheet.
Recession on paper: What really moves the Canadian Loonie now?

Statistics Canada handed the headline writers a gift and the analysts a headache. Real GDP shrank 0.1% on an annualized basis in the first quarter, and with the fourth quarter of 2025 revised down to a 1.0% contraction, that is two negative quarters in a row, the textbook definition of a technical recession and Canada's first since the pandemic.