|

Silver Price Analysis: XAG/USD flirts with two-day lows, around $27.75-70 area

  • Silver witnessed some follow-through selling for the second consecutive session on Monday.
  • Mixed technical indicators warrant some caution before placing any aggressive directional bets.

Silver extended the previous day's retracement slide from one-and-half-week tops and witnessed some follow-through selling on the first day of a new trading week. This marked the second consecutive day of a negative move and dragged the commodity to two-day lows, around the $27.70 region during the early European session.

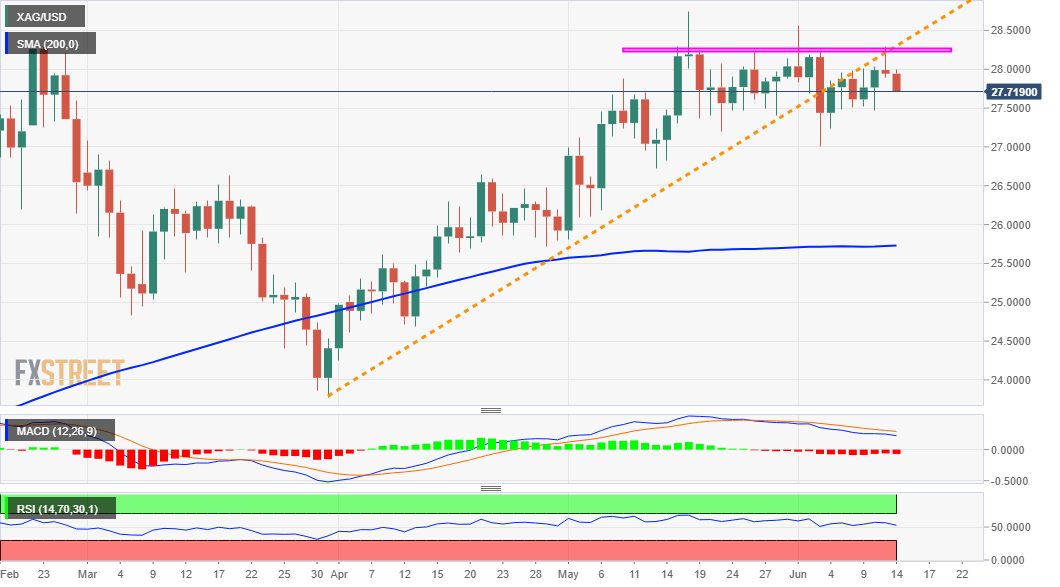
From a technical perspective, last week's positive move faltered near the $28.25-30 region, marking a short-term ascending trend-line support breakpoint, now turned resistance. This should now act as a key pivotal point for short-term traders and help determine the next leg of a directional move for the XAG/USD.

Meanwhile, technical indicators on hourly charts have been drifting lower in the bearish territory and support prospects for additional intraday weakness. That said, oscillators on the daily chart – though have been losing the positive momentum – are yet to confirm a bearish bias and warrant some caution for traders.

Hence, any subsequent fall is more likely to find decent support near the $27.40 region, or the lower boundary of a near one-month-old trading range. This is followed by the $27.20 horizontal support and the $27.00 mark, which if broken might be seen as a fresh trigger for bearish traders and prompt aggressive selling.

The next relevant support is pegged near the $26.60 area. Some follow-through selling might turn the XAG/USD vulnerable to accelerate the fall further towards the $26.00 mark. The downward trajectory could further get extended towards challenging the very important 200-day SMA, currently near the $25.75-70 region.

On the flip side, the $28.00 mark now seems to act as an immediate strong resistance ahead of the $28.25-30 supply zone. Sustained strength above has the potential to push the XAG/USD towards monthly tops, around the $28.75 region. Bulls might eventually push the commodity beyond the $29.00 mark, towards testing the $29.40-50 hurdle.

XAG/USD daily chart

fxsoriginal

Technical levels to watch

XAG/USD

Overview
Today last price27.74
Today Daily Change-0.20
Today Daily Change %-0.72
Today daily open27.94
 
Trends
Daily SMA2027.86
Daily SMA5026.85
Daily SMA10026.57
Daily SMA20025.73
 
Levels
Previous Daily High28.29
Previous Daily Low27.9
Previous Weekly High28.29
Previous Weekly Low27.47
Previous Monthly High28.75
Previous Monthly Low25.81
Daily Fibonacci 38.2%28.05
Daily Fibonacci 61.8%28.14
Daily Pivot Point S127.8
Daily Pivot Point S227.65
Daily Pivot Point S327.41
Daily Pivot Point R128.19
Daily Pivot Point R228.43
Daily Pivot Point R328.58

Author

Haresh Menghani

Haresh Menghani is a detail-oriented professional with 10+ years of extensive experience in analysing the global financial markets.

More from Haresh Menghani
Share:

Editor's Picks

GBP/USD loses momentum, flirts with 1.3200

GBP/USD is struggling to maintain its positive bias on Thursday, retreating toward the 1.3200 region in response to the pick in the buying interest around the Greenback. That said, Cable remains under scrutiny as cautious market sentiment keeps investors focused on the US-Iran conflict and political effervescence in the UK.

EUR/USD trims gains, challenges 1.1400

EUR/USD now gives away part of its earlier advance, receding toward the 1.1400 contention zone on Thursday. Meanwhile, the pair’s recovery comes amid extra losses in the US Dollar, at the time when while investors continue to monitor developments in the Middle East and sentiment surrounding global technology stocks.

Gold remains bid and close to $4,100

Gold accelerates its recovery and approaches the key $4,000 mark per troy ounce at the end of the week, adding to Thursday’s advance. However, expectations for a hawkish Fed remain steady and keep the yellow metal’s potential upside contained.

Crypto Today: Bitcoin at $60,000, Ethereum at $1,500, and XRP at $1 face a make-or-break test

Bitcoin (BTC), Ethereum (ETH), and Ripple (XRP) are trading in the red on Friday after three consecutive days of losses, testing their respective make-or-break support levels.

Week ahead – NFP report to challenge Dollar strength and the hawkish Fed

Dollar strength dominates markets, as the hawkish Fed overshadows geopolitics and lower oil prices. NFP week could drive September Fed hike expectations and boost market volatility. The euro lacks fresh bullish catalysts, all eyes on the preliminary inflation report and the ECB Forum.

Regime change: Inside Kevin Warsh's first move to make the Fed unreadable on purpose

The rate did not move. That was the least interesting thing about Kevin Warsh's first meeting in charge of the Fed. The FOMC held its benchmark at 3.50%-3.75% for the fourth straight meeting, exactly as priced, and then the new chair used his first press conference to dismantle the machinery the market has leaned on for a decade.