Silver Price Analysis: XAG/USD flirts with $23.30-20 support. seems vulnerable


  • Silver meets with a fresh supply on Tuesday and seems vulnerable to sliding further.
  • Last week’s breakdown below the $23.80-$23.75 confluence favours bearish traders.
  • A sustained move back above the $24.00 mark is needed to negate the negative bias.

Silver comes under heavy selling pressure on Tuesday and slides back to the $23.30-$23.20 support zone during the early part of the European session. The technical setup, meanwhile, favours bearish traders and supports prospects for a further near-term depreciating move.

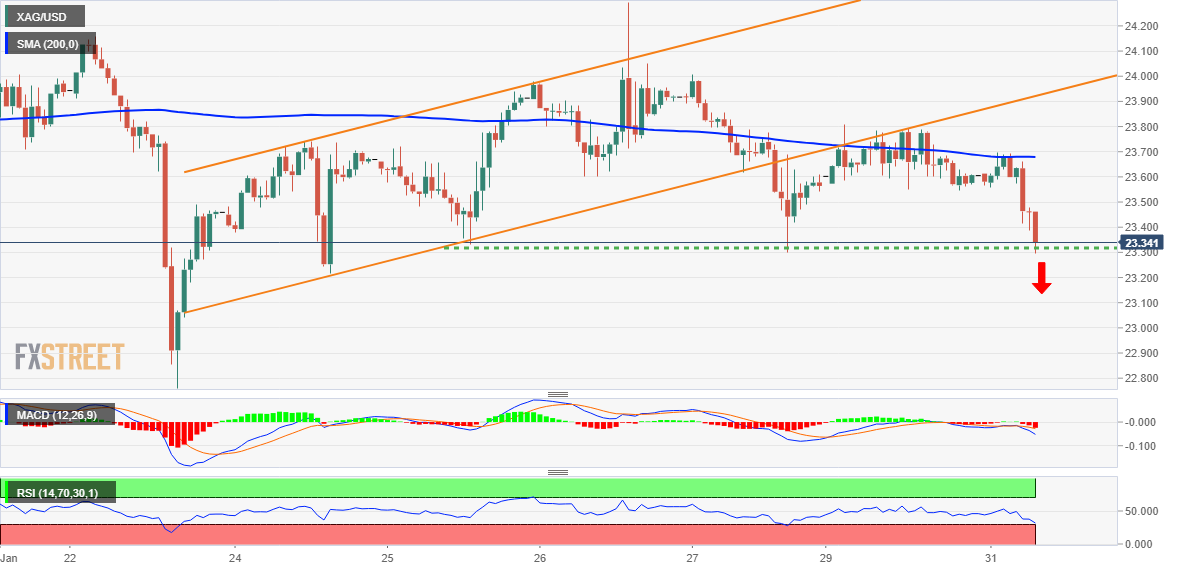
The XAG/USD last week confirmed a breakdown below the $23.70-$23.80 confluence support, comprising the 200-hour SMA and the lower end of a short-term ascending channel. The overnight failure near the said support breakpoint, now turned resistance, adds credence to the negative outlook. Moreover, oscillators on the daily chart have just started gaining negative traction.

Some follow-through selling below the $23.30-$23.20 area will reaffirm the bearish outlook and make the XAG/USD vulnerable to weaken further below the $23.00 mark. The next relevant support is pegged near the $22.75 area, below which the downward trajectory could get extended and drag the white metal towards the $22.20-$22.15 intermediate support en route to the $22.00 level.

Meanwhile, Relative Strength Index (RSI) on the 1-hour chart has moved on the verge of breaking into oversold territory. This makes it prudent to wait for some intraday consolidation or a modest rebound before positioning for additional losses. That said, any attempted recovery might now confront stiff resistance near the $23.60-$23.70 region, or the 100-hour SMA.

Any subsequent move up could attract fresh sellers and remain capped near the ascending trend-channel support breakpoint, currently around the $24.00 mark. The latter should act as a pivotal point, which if cleared decisively is likely to trigger a short-covering rally. The XAG/USD might then aim to retest the multi-month to, around the $24.50-$24.55 area touched in January.

Silver 1-hour chart

fxsoriginal

Key levels to watch

XAG/USD

Overview
Today last price 23.31
Today Daily Change -0.26
Today Daily Change % -1.10
Today daily open 23.57
 
Trends
Daily SMA20 23.75
Daily SMA50 23.26
Daily SMA100 21.53
Daily SMA200 21.01
 
Levels
Previous Daily High 23.81
Previous Daily Low 23.54
Previous Weekly High 24.3
Previous Weekly Low 22.76
Previous Monthly High 24.3
Previous Monthly Low 22.03
Daily Fibonacci 38.2% 23.65
Daily Fibonacci 61.8% 23.71
Daily Pivot Point S1 23.48
Daily Pivot Point S2 23.38
Daily Pivot Point S3 23.21
Daily Pivot Point R1 23.74
Daily Pivot Point R2 23.91
Daily Pivot Point R3 24


Share: Feed news

Information on these pages contains forward-looking statements that involve risks and uncertainties. Markets and instruments profiled on this page are for informational purposes only and should not in any way come across as a recommendation to buy or sell in these assets. You should do your own thorough research before making any investment decisions. FXStreet does not in any way guarantee that this information is free from mistakes, errors, or material misstatements. It also does not guarantee that this information is of a timely nature. Investing in Open Markets involves a great deal of risk, including the loss of all or a portion of your investment, as well as emotional distress. All risks, losses and costs associated with investing, including total loss of principal, are your responsibility. The views and opinions expressed in this article are those of the authors and do not necessarily reflect the official policy or position of FXStreet nor its advertisers. The author will not be held responsible for information that is found at the end of links posted on this page.

If not otherwise explicitly mentioned in the body of the article, at the time of writing, the author has no position in any stock mentioned in this article and no business relationship with any company mentioned. The author has not received compensation for writing this article, other than from FXStreet.

FXStreet and the author do not provide personalized recommendations. The author makes no representations as to the accuracy, completeness, or suitability of this information. FXStreet and the author will not be liable for any errors, omissions or any losses, injuries or damages arising from this information and its display or use. Errors and omissions excepted.

The author and FXStreet are not registered investment advisors and nothing in this article is intended to be investment advice.

Recommended content


Recommended content

Editors’ Picks

AUD/USD keeps range near 0.6500 after Australian CPI data

AUD/USD keeps range near 0.6500 after Australian CPI data

AUD/USD keeps wavering near 0.6500 in Wednesday's Asian trading. The Aussie faces headwinds from softer Australian CPI inflation data for May, which fans RBA rate cut expectations. A softer US Dollar, however, lends support to the pair despite a cautious market mood. 

USD/JPY stalls the rebound below 145.00 after Japan's PPI, BoJ commentary

USD/JPY stalls the rebound below 145.00 after Japan's PPI, BoJ commentary

USD/JPY stalls the bounce below 145.00 following strong Japanese Services PPI data, which supports the case for more BoJ rate hikes and the Japanese Yen, despite the mixed BoJ's June Summary of Opinions. Meanwhile, the US Dollar's downside bias also keeps the pair on the defensive. 

Gold defends 50-day SMA, but for how long?

Gold defends 50-day SMA, but for how long?

Gold price is building on its previous rebound early Wednesday, snapping a three-day bearish streak as the US Dollar rebound fizzles ahead of day 2 of Federal Reserve Chair Jerome Powell’s congressional testimony and mid-tier US data.

SEI, SYRUP, APT eye further gains as investors focus on Made in America tokens

SEI, SYRUP, APT eye further gains as investors focus on Made in America tokens

Sei extends the weekly run on Wednesday, hitting a new two-month high. Maple Finance records a new all-time high, nearing a channel breakout. Aptos ticks lower after two days of recovery, bouncing off the lower boundary of a falling channel. 

Could Iran block the Strait of Hormuz? Why Oil is on edge after US strikes

Could Iran block the Strait of Hormuz? Why Oil is on edge after US strikes

As the Israel-Iran conflict reaches new heights, an old threat is coming back to haunt the markets: that of the closure of the Strait of Hormuz. This narrow arm of the sea in the Persian Gulf, wedged between Iran to the north and the United Arab Emirates and Oman to the south, is much more than a simple sea passage.

The Best brokers to trade EUR/USD

The Best brokers to trade EUR/USD

SPONSORED Discover the top brokers for trading EUR/USD in 2025. Our list features brokers with competitive spreads, fast execution, and powerful platforms. Whether you're a beginner or an expert, find the right partner to navigate the dynamic Forex market.

Forex MAJORS

Cryptocurrencies

Signatures

Best Brokers of 2025